Your domain authority is solid. Your keyword rankings haven’t dropped. But someone on your team just searched for your product category in ChatGPT and your brand wasn’t mentioned once, while two direct competitors appeared in the top three recommendations. The problem isn’t your SEO. It’s that the metrics you’re using to measure success weren’t built to see AI search at all.
Around 70.6% of traffic originating from AI platforms is misclassified as “Direct” in GA4. So the AEO and GEO work you’ve been doing? A chunk of its impact is already showing up in your reports, just buried under the wrong label.
Here’s how to build a GEO dashboard around the KPIs that actually tell you what’s happening.
Your Analytics Dashboard Can’t See AI Traffic
Before covering which KPIs for AEO matter, it’s worth understanding why your current setup is blind to them.
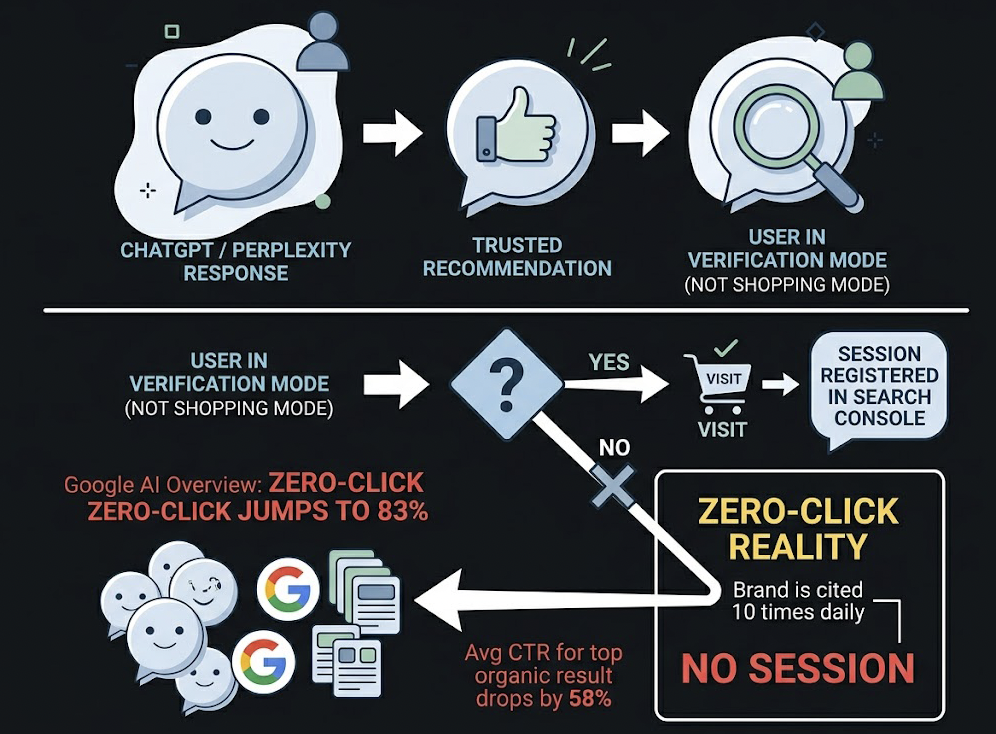
When a user asks ChatGPT for a software recommendation and then navigates directly to your site, they typically copy the URL into a new browser tab. No referrer header gets passed. GA4 logs the visit as “Direct.” This is what researchers call “Dark AI” traffic, and it’s a significant blind spot: that same traffic converts at a transactional rate of 10.21%, roughly 4.1 times higher than standard non-AI traffic.
The scale of the underlying activity makes this more urgent. ChatGPT’s crawl-to-refer ratio sits at approximately 3,700:1, meaning for every visitor it sends to your site, it may have crawled and ingested your content 3,700 times. For Claude, that ratio expands to roughly 500,000:1. AI platforms are extracting value from your content at a rate that never shows up in referral data.
This is compounded by the zero-click reality. About 60% of all searches end without a website visit, with user intent satisfied directly in the interface. When a Google AI Overview is triggered, that zero-click rate jumps to 83%, and the average CTR for the top organic result drops by 58%. A brand can be cited ten times daily across AI platforms and register zero sessions in Search Console.
That’s the gap a GEO dashboard is designed to close.
The 7 KPIs for AEO That Actually Matter
These metrics shift the frame from “winning a click” to “winning a citation.” Each one maps to a specific question your team needs to answer.
#1 AI Visibility Rate (Citation Rate)
This is the baseline KPI: what percentage of your target prompts return a response that mentions your brand?
The formula is straightforward. Divide the number of queries where your brand appears by the total number of tested queries, then multiply by 100. For B2B SaaS, 8-15% typically indicates minimal presence. Category leadership in most verticals starts around 40-50%. Run this across a defined prompt library covering purchase-intent, comparison, and informational queries, not just branded terms.
#2 Answer Placement Score (APS)
Being cited isn’t enough. The third recommendation in a conversational AI response carries a fraction of the value of the first.
APS assigns weighted credit by position: the primary recommendation scores 1.0, the second approximately 0.6, and anything lower typically drops below 0.3, which is effectively irrelevant in a conversational context. A brand with a 25% Citation Rate but consistently low APS scores is being mentioned without being recommended. That’s a very different strategic problem.
#3 Sentiment Polarity
AI platforms don’t just list brands. They characterize them. “Ideal for enterprise security teams” and “a reasonable budget option” are both citations. Only one of them maps to your positioning.
Sentiment Polarity uses NLP to assess how generative engines frame your brand. It also captures Recommendation Strength: whether the AI “soft” suggests your product (“you might consider…”) or hard-endorses it (“the most reliable option for…”). A Sentiment Score shift is often the first signal that something in your content strategy needs to change.
#4 Feature Association Coverage
This KPI measures whether AI models associate your brand with the right value propositions.
If your company’s strategic goal is to be recognized for AI-native analytics, but generative models primarily describe you as a “legacy reporting tool,” there’s a positioning gap. Feature Association Coverage tracks the percentage of brand mentions that include your target thematic keywords. It’s how you validate whether your messaging has actually permeated the model’s retrieval context.
#5 Branded Search Lift
Successful AEO frequently drives zero-click awareness that surfaces later as a branded search.
A user encounters your brand in a ChatGPT summary, doesn’t click through immediately, but searches for you by name later in the day. That shows up in Search Console as branded search volume, not as an AI referral. Tracking the correlation between rising AI visibility and rising branded search volume gives you a measurable proxy for AEO impact, even when direct attribution is impossible.
#6 Source Citation Rate
AI models are 6.5 times more likely to cite a brand through an external authoritative source than through its own website. This makes third-party mentions, Reddit threads, G2 reviews, and independent editorial coverage as strategically important as owned content.
Source Citation Rate tracks which domains are “carrying” your brand’s visibility in AI retrieval. If AI models consistently surface your brand through a competitor comparison article on a third-party review site, that article is functioning as a citation asset, and you need to know about it.
#7 Conversion Visibility Rate (CVR)
The final KPI connects visibility to revenue intent. CVR estimates the probability that an AI response will lead a user toward a brand interaction, based on the query type, placement, sentiment, and response structure.
This isn’t direct conversion tracking. It’s a predictive signal that helps prioritize which prompt clusters to invest in. High CVR prompts with low Citation Rates represent your clearest content gap opportunities.
How to Structure Your GEO Dashboard
A functional GEO dashboard isn’t a single view. It’s three layers, each answering a different question.
The Monitoring Layer covers daily and weekly brand health. Citation Rate, Mention Frequency, and Share of Voice across the major AI platforms: ChatGPT, Perplexity, Gemini, and Google AI Overviews. Because generative outputs are non-deterministic, these scores should be based on rolling averages across a defined prompt library, not single-query snapshots. This layer answers: “Are we visible this week?”
The Analysis Layer goes qualitative. Sentiment Polarity trends, Feature Association Coverage, and Source Citation Distribution live here. This layer answers: “Why is our visibility what it is?” It surfaces which third-party domains are influencing AI citations and where your brand’s framing is drifting from its intended positioning.
The Action Layer converts data into work orders.
That’s the layer most teams skip. It includes content decay alerts for URLs that have dropped in retrieval performance, competitive displacement notifications when a rival brand displaces yours for a high-value prompt cluster, and gap reports that identify subtopics your competitors own in AI responses but you have no content covering. Without this layer, a dashboard is a scoreboard with no scoreboard.
| Dashboard Layer | Core Metrics | Reporting Cadence |
|---|---|---|
| Monitoring | Citation Rate, Visibility %, Mention Frequency | Weekly |
| Analysis | Sentiment, Feature Association, Source Distribution | Bi-weekly |
| Action | Content Decay Alerts, Gap Reports, Competitor Displacement | Continuous |
Competitor Benchmarking Makes These KPIs Meaningful
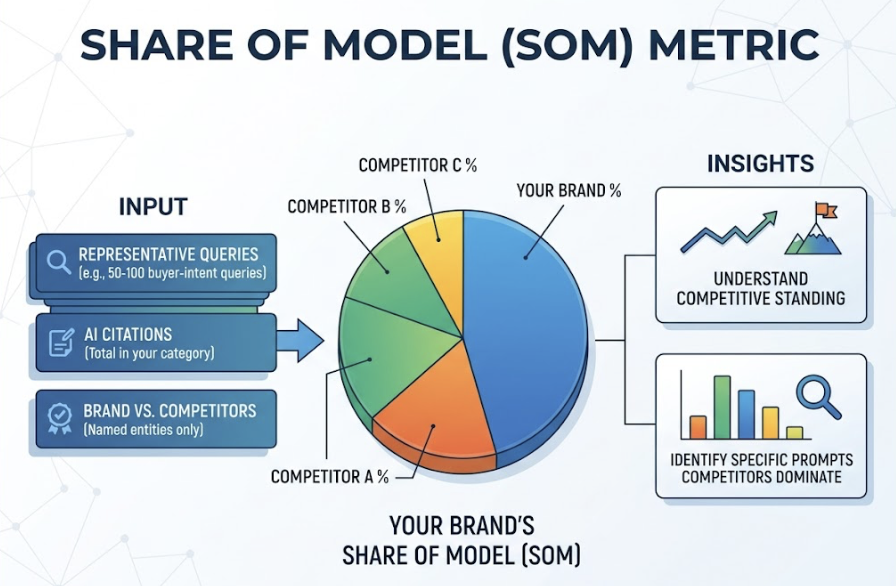
A 20% Citation Rate sounds decent until you learn your top competitor is at 62%.
This is why absolute visibility scores need competitive context. The most useful framing is Share of Model (SoM): what percentage of AI citations in your category go to your brand versus all named competitors, across a representative set of 50-100 buyer-intent queries? SoM reveals not just where you stand, but which specific prompts competitors dominate.
From that analysis, prompt clusters split into two categories.
Defensive prompts are queries where you currently lead. These need continuous monitoring. A competitor publishing fresher data or better-structured content can displace you without any algorithmic update. The mechanism is retrieval-based: if their content provides a more complete, extractable answer, the model will prefer it.
Offensive prompts are queries where competitors lead but you have no presence. These are your clearest content investment opportunities. Industry benchmarks for 2026 show the IT sector sees AI referral traffic around 2.8%, the highest across tracked verticals. For most B2B SaaS categories, the difference between a 15% and a 45% Share of Model typically comes down to prompt coverage and content freshness, not domain authority.
One Platform That Tracks All 7 KPIs Natively
Building a custom AEO dashboard means scraping multiple AI platforms, processing unstructured conversational text, running manual prompt tests on a regular cadence, and rebuilding the analysis every time a platform updates its behavior. Most teams that start down that path abandon it within 60 days.
Topify tracks all seven core AEO KPIs natively across ChatGPT, Gemini, Perplexity, DeepSeek, and several other platforms. The platform covers Visibility Rate, APS, Sentiment Polarity, Feature Association, Branded Search correlation, Source Analysis, and CVR in a single dashboard, without requiring manual prompt submission.
A few specific capabilities are worth noting. Topify’s Source Analysis and Gap Detection reveals which third-party domains are driving your AI citations, where your coverage is weak, and which competitors are benefiting from sources you haven’t prioritized. Its Competitor Monitoring runs continuously, so if a rival brand displaces yours as the primary recommendation for a high-value query cluster, you get an alert rather than discovering it a month later in a manual audit.
The Basic plan starts at $99/month and covers 100 prompts with 9,000 AI answer analyses across four projects. For teams just getting started with GEO measurement, that’s enough prompt coverage to establish baseline Citation Rates and Share of Model across a primary product category. The Pro plan at $199/month expands to 250 prompts and 22,500 analyses, which supports multi-category tracking or competitive prompt libraries.
Other platforms serve specific segments well. Profound focuses on enterprise compliance requirements and Fortune 500 technical audit needs. Frase works for content teams that need to optimize for Google rankings and AI citations simultaneously, noting that only 38% of AI citations come from the top 10 Google results, so organic authority alone doesn’t guarantee AI visibility. Each platform reflects a different set of trade-offs, but for teams that need native coverage of all seven AEO KPIs in one place, Topify is the practical starting point.
The Measurement Mistakes Most AEO Teams Make
A few patterns show up consistently across teams that invest in GEO measurement but don’t get traction.
Tracking only one AI platform. ChatGPT has the largest public mindshare, but it isn’t where all AI-assisted discovery happens. A brand with a 45% Citation Rate on ChatGPT and a 9% rate on Perplexity has a real gap, especially if their audience skews toward technical or research-oriented users who tend to favor Perplexity for commercial queries.
Ignoring Sentiment while optimizing for Visibility. A rising Citation Rate paired with a declining Sentiment Score is not progress. It means AI models are mentioning your brand more often in negative or misframed contexts. Teams that optimize purely for presence without monitoring how they’re being characterized can accelerate brand positioning problems rather than fix them.
Prompt coverage that’s too narrow. Many teams start by tracking branded queries only, checking whether their brand appears when someone searches for them by name. That’s the wrong set. AEO value comes from showing up for category-level, comparison, and use-case prompts where the user has no brand preference yet. Those are the queries that drive discovery.
Treating AEO as a one-time project. Research shows that 50% of content cited in AI answers is less than 13 weeks old. Content published and left static will see its citation rate decay as competitors publish fresher data and better-structured answers. Additionally, 44% of all AI citations come from the first third of a piece of text (Princeton GEO study, KDD 2024), so structural updates to where key answers are positioned in your content can have a faster impact than publishing new pages.
Conclusion
The brands that win AI search visibility aren’t necessarily the ones with the highest domain authority. They’re the ones that know what they’re measuring and act on it at the right cadence.
Start with AI Visibility Rate and Answer Placement Score to establish a baseline. Add Sentiment Polarity to catch positioning drift early. Build toward Share of Model benchmarking once your prompt library is large enough to be representative. The seven KPIs for AEO outlined here aren’t a replacement for your existing analytics stack. They’re the layer that fills in what your current dashboard can’t see. Get started with Topify to run your first visibility audit across the AI platforms your audience is actually using.
FAQ
Q: What’s the difference between AEO KPIs and GEO KPIs?
A: The terms are often used interchangeably, but there’s a useful distinction. AEO (Answer Engine Optimization) KPIs focus on visibility in direct answer interfaces, such as Citation Rate and Answer Placement Score. GEO (Generative Engine Optimization) KPIs extend that frame to include how AI models synthesize and characterize brands across longer conversational responses, covering Sentiment Polarity, Feature Association, and Source Citation patterns. In practice, an effective dashboard tracks both sets together.
Q: How often should I check my GEO dashboard metrics?
A: Citation Rate and Mention Frequency are worth reviewing weekly, since generative models update their retrieval behavior more frequently than traditional search algorithms. Sentiment trends and Source Distribution are better reviewed bi-weekly or monthly, as they shift more gradually. The action layer, specifically content decay alerts and competitor displacement notifications, should be monitored continuously if you’re running an active GEO strategy.
Q: Can I track AEO KPIs for free without a dedicated tool?
A: Manual tracking is possible but limited. You can run weekly prompt tests across ChatGPT and Perplexity and log whether your brand appears, roughly estimating Citation Rate. Sentiment analysis would need to be done by reading responses manually. Source tracking requires identifying which URLs AI responses reference and cross-checking them against your domain. At 50-100 prompts across 3-4 platforms, the manual workload becomes unsustainable for most teams within the first month.
Q: What’s a realistic AI Visibility Rate target for a B2B SaaS brand?
A: For most B2B SaaS categories, an 8-15% Citation Rate indicates minimal presence. Reaching 25-35% across a representative prompt library typically signals a content strategy that’s working. Category leadership, where your brand is the default first-mention in AI responses for your core use cases, generally requires a 40-50% or higher rate. The useful benchmark, though, is relative to your specific competitors in a Share of Model framework rather than an absolute percentage.

