Your quarterly board deck has 40 slides on SEO performance. Domain authority is up. Organic traffic grew 12%. Keyword rankings look solid. Then your CEO asks one question: “Are we showing up when someone asks ChatGPT for a recommendation in our category?” And you don’t have an answer.
That silence is becoming the most expensive gap in enterprise marketing. While 89% of enterprise leaders report measurable gains from AI search in 2025, roughly 26% still can’t trace the user journey from AI discovery to final conversion, and 24% admit their analytics infrastructure isn’t built for AI attribution. The data exists. The translation layer doesn’t.
Why Most AI Visibility Reports Get Ignored in the Boardroom
The problem isn’t a lack of metrics. It’s that marketing teams keep presenting AI visibility data through the lens of traditional SEO, and executives don’t speak that language.
Traditional SEO reports focus on the “how”: crawling, indexing, backlink profiles. The C-Suite needs the “why”: how AI presence translates into revenue, market share, and competitive defensibility. When a VP of Marketing shows a dashboard full of prompt-level data without tying it to pipeline impact, the executive response is predictable. “So what?”
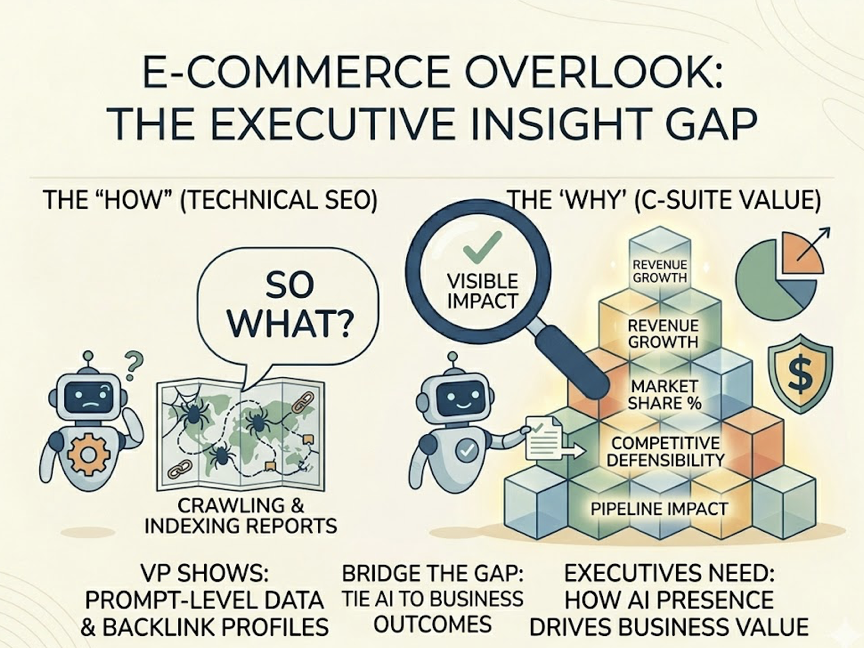
That disconnect turns AI visibility programs into what leadership perceives as discretionary experiments rather than core revenue drivers. Budgets stall. Headcount requests get deprioritized. And competitors who’ve figured out the reporting piece pull further ahead in the fastest-growing search category.
Here’s what shifted: the discovery interface itself changed. The old model gave users ten blue links and let them choose. Generative search gives one to three synthesized recommendations, each carrying an implicit endorsement. The economic unit moved from cost-per-click to cost-per-mention. The trust signal moved from backlinks to multi-source consensus.
| Dimension | Traditional Search | Generative Search |
|---|---|---|
| User Interaction | Keywords and blue links | Conversational prompts and synthesized answers |
| Primary Metric | Organic clicks and traffic | Share of Model and citations |
| Trust Signal | Backlinks and PageRank | Entity confidence and multi-source consensus |
| Discovery Result | 10 results per page | 1-3 direct recommendations |
| Economic Unit | Cost Per Click | Cost Per Mention/Citation |
If your reporting framework hasn’t caught up to this shift, your leadership team is making decisions with a map from 2019.
5 AI Visibility Tracking Metrics That Belong in Every Executive Report
To move from reporting activity to reporting influence, marketing leaders need to strip the metric set down to what actually drives board-level decisions. These five, drawn from Topify’s seven-metric framework, map directly to business outcomes executives already care about.
Visibility Score: Your Market Reach in AI Discovery
The Visibility Score measures the percentage of target prompts where your brand appears across major AI platforms. For an executive, this is the digital equivalent of “mental availability.”
In a market where 58% of consumers now use AI for product research, a Visibility Score below 30% in your core category means you’re functionally invisible to more than half your prospective buyers. A score above 80% signals category dominance. Anything in between reveals specific “semantic holes” where the model doesn’t perceive your brand as a relevant option.
Sentiment Score: Real-Time Brand Equity Monitoring
An AI response doesn’t just list your brand. It characterizes it. The Sentiment Score uses NLP to rate the tone of AI recommendations on a scale of -100 to +100.
Being mentioned frequently becomes a liability if every mention comes with a caveat like “users often report slow onboarding” or “the interface feels dated.” Tracking sentiment lets the team catch and counter negative narratives before they harden into the model’s training data.
Position Rank: The New “Position 1”
AI platforms typically recommend three to five brands per query. The brand in first position carries an implicit endorsement that dwarfs every subsequent mention.
If your brand consistently lands third or fourth, its influence on the user’s decision is minimal compared to the first-position competitor. For B2B SaaS and enterprise finance, where high-consideration purchases are the norm, Position Rank is the single clearest indicator of competitive standing.
Citation Share: Authority You Can Measure
As AI platforms lean harder on Retrieval-Augmented Generation (RAG), the sources they cite become the battleground for authority. Citation Share tracks what percentage of outbound links point to your domain versus competitors.
The data here is striking: 85.5% of AI citations reference earned media rather than brand-owned sites. That tells the CMO exactly where to allocate PR and content partnership budgets. It also gives the board a concrete measure of the brand’s status as a “source of truth” in its category.
Conversion Visibility Rate: The Revenue Metric
CVR connects AI mentions directly to on-site revenue. By integrating with GA4 or Shopify, it estimates the economic value of an AI mention based on recommendation context and prompt intent.
AI-referred visitors tend to convert at rates up to 5x higher than traditional organic traffic (14.2% vs. 2.8%), because the AI has already pre-qualified their intent. When you can show the CFO that AI mentions generated a specific number of qualified demos last quarter, visibility stops being a brand play and starts looking like a highly efficient lead generation channel.
| Traditional SEO Metric | AI Visibility Equivalent | Why the C-Suite Cares |
|---|---|---|
| Monthly Traffic | Visibility Score | Overall market reach in AI discovery |
| Backlink Count | Citation Share | Brand authority and “source of truth” status |
| Keyword Ranking | Position Rank | Trust and likelihood of direct recommendation |
| Branded Search | Mention Frequency | Brand strength as an entity in the model’s memory |
| Site Conversion | CVR | Direct connection between AI presence and revenue |
How to Structure a Monthly AI Visibility Tracking Report
An effective report follows the inverted pyramid: the most critical business impact goes on page one. Supporting evidence and tactical details follow. If your CMO has three minutes, they should still walk away with a clear decision.
Layer 1: Executive Summary
This is a standalone one-pager. It leads with a headline narrative that puts the month’s performance in business terms: “AI Visibility Score increased 15% following the restructuring of our comparison guides, contributing to a 22% lift in pre-qualified demo requests from enterprise accounts.”
Four components, nothing more: an overall AI Visibility Score (0-100) as a quick health check, a Citation Gap comparison against the top three competitors, a revenue impact figure tied to AI-referred traffic, and three action items for the next cycle.
Layer 2: Platform and Competitor Deep Dive
The second layer explains the “why” behind the executive summary. It breaks performance down by platform (ChatGPT, Perplexity, Gemini) and by competitor.
This is where you’ll spot fragmentation. A brand might be highly visible in Perplexity’s research-driven environment but absent from ChatGPT’s conversational responses. The report should show where competitors are winning share of voice and which specific sources (Reddit threads, G2 pages, industry blogs) the AI is using to back those competitors.
Layer 3: Action Items and Roadmap
Every metric must connect to execution. If sentiment dropped, the action item might be a content refresh targeting outdated statistics. If citation share slipped, the roadmap should prioritize a targeted PR push to authoritative industry publications. No finding without a “now what.”
Weekly, Monthly, Quarterly: Matching Cadence to Decisions
Not every stakeholder needs the same report at the same frequency. The cadence should match the speed of decisions each audience makes.
Weekly reports serve the marketing operations team. The focus is speed over precision: flag sudden drops in visibility or sentiment that signal a technical error or a competitor’s aggressive content push. Monitoring a core set of 25-35 prompts weekly lets the team adjust campaigns still in flight.
Monthly reports are the core rhythm for the VP of Marketing or Director. This is where trend analysis happens and budget reallocations occur, like shifting funds from traditional link building to entity-building activities that AI models prioritize.
Quarterly reports go to the C-Suite and the board. They ladder up to OKRs, map market share trends over multiple cycles, and assess strategic risks like model drift or new platform partnerships that could reshape the visibility landscape.
| Cadence | Audience | Focus | Impact |
|---|---|---|---|
| Weekly | Marketing Operations | Anomaly detection, prompt-level SOV | Tactical course correction |
| Monthly | Marketing Directors | Trend analysis, competitor gap analysis | Strategy and budget adjustment |
| Quarterly | C-Suite / Board | Pipeline ROI, market share, strategic risk | Multi-quarter goal setting |
How Topify Powers Enterprise-Scale AI Visibility Tracking
For teams building this reporting infrastructure from scratch, Topify serves as the operating system for AI search intelligence. Unlike traditional SEO tools that have added AI features as afterthoughts, Topify was built natively for the generative era, with a proprietary database and LLM-research-backed methodology.
The platform covers the full optimization lifecycle. Its AI Visibility Checker automates prompt testing across ChatGPT, Perplexity, Gemini, and Google AI Overviews to establish a real-time baseline. The citation tracking engine identifies the exact third-party domains driving competitor recommendations, turning passive monitoring into competitive intelligence. And when it detects a visibility gap, Topify’s One-Click Execution provides guided workflows to restructure content into formats AI models prefer.
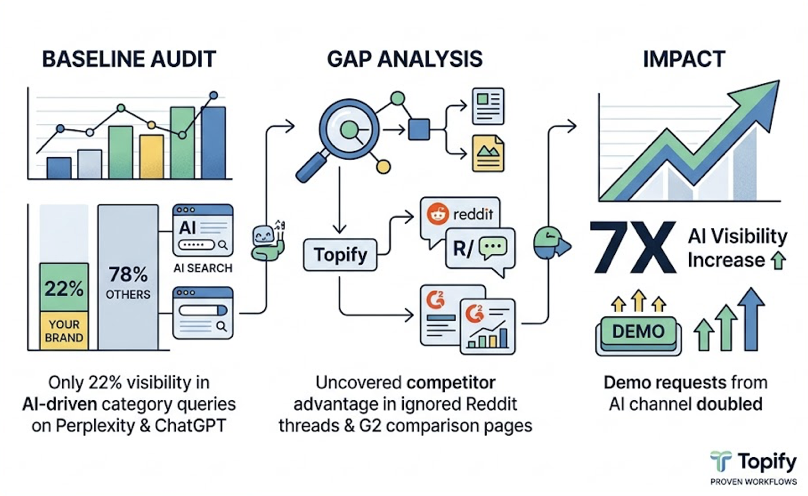
Here’s what that looks like in practice. A VP of Marketing at a growth-stage SaaS company runs a baseline audit and discovers their brand appears in only 22% of “category leader” prompts across Perplexity and ChatGPT. Topify’s gap analysis reveals the top competitor is winning because of three high-authority Reddit threads and two G2 comparison pages the VP’s team had ignored. After restructuring five core product pages using Topify’s execution workflows, the brand sees a 7x increase in AI visibility within 30 days, and demo requests from the AI channel double.
Enterprise plans start at $499/mo with dedicated account management, custom configurations, and coverage across regional platforms including DeepSeek and Qwen. Smaller teams can start at $99/mo with the Basic Plan.
3 Reporting Mistakes That Kill Executive Buy-In
Even with the right data, poor framing can undermine the entire program. These three patterns show up repeatedly in organizations that struggle to secure C-Suite support.
Reporting activity instead of outcomes. Executives don’t care how many meta tags got updated or how many prompts were tested. They care whether those activities protected market share or moved pipeline. The fix: frame every technical achievement as a business implication. Instead of “we fixed our schema,” try “we restructured our technical data so AI agents accurately cite our pricing and security features, reducing misinformation risk in the pre-purchase phase.”
Missing the competitive baseline. Without a comparison point, data is just a number. If your Visibility Score is 45%, is that good? Executives can’t tell unless they know the nearest competitor sits at 72%. Always include a “Citation Gap” or “Share of Model” comparison in the executive summary. Showing that a competitor gets cited 3x more often creates an immediate imperative for action that performance-only tracking can’t match.
Presenting the “what” without the “so what” and “now what.” A report that shows a drop in visibility without explaining the cause or proposing a fix reads like a vanity audit, not a strategic document. Follow the Rule of Three: for every finding, provide a reasoning and a recommendation. “Finding: Citation rate dropped 10%. Reason: A competitor launched a comprehensive industry whitepaper now cited across four platforms. Recommendation: Accelerate our Q3 original research release to reclaim the source-of-truth position.”
Conclusion
AI visibility tracking isn’t primarily a technical challenge. It’s a communication challenge. The organizations winning in generative search are the ones that can translate complex LLM behavior into the language of revenue, risk, and competitive positioning.
Your leadership team doesn’t need more data. They need a reporting framework that answers three questions in under a minute: Are we visible? Are we winning? What do we do next? Build that cadence, back it with the right metrics, and AI visibility stops being a line item the CFO questions. It becomes the growth lever your CEO asks about first.
Ready to build your first enterprise-grade AI visibility report? Get started with Topify and see where your brand stands across every major AI platform.
FAQ
What is AI visibility tracking?
AI visibility tracking is the systematic measurement of how frequently, prominently, and favorably a brand appears in responses generated by large language models and generative search engines like ChatGPT, Perplexity, and Gemini. It goes beyond traditional rank tracking by analyzing the synthesized content, citations, and sentiment of the AI’s answer.
How often should you report AI visibility to executives?
A monthly cadence works best for strategic reporting to the C-Suite, providing enough time for trends to stabilize and optimization efforts to show results. Supplement this with weekly tactical monitoring for the marketing team and quarterly strategic reviews that align AI visibility goals with annual business OKRs.
What KPIs should a C-suite AI visibility report include?
Focus on five metrics with direct business impact: Visibility Score (market reach), Sentiment Score (brand reputation), Position Rank (trust and recall), Citation Share (authority), and Conversion Visibility Rate (revenue attribution). Each metric should be presented alongside a competitive benchmark.
How is AI visibility tracking different from traditional SEO reporting?
Traditional SEO reports focus on clicks, keyword rankings, and backlink counts within a static list of blue links. AI visibility tracking measures mentions, citations, and sentiment within generative conversational interfaces where influence often happens without a direct website visit. The fundamental shift is from tracking traffic to tracking endorsement.

