Your Google Analytics report shows six traffic channels. You glance at organic and paid, maybe check direct when it spikes, and move on. That’s how most marketing decisions get made, and it’s a problem. Research shows over 60% of marketing decisions are based on just two of those channels, which means the data sitting in the other four is quietly shaping your results without anyone reading it.
The labels aren’t the issue. The interpretations are.
The 6 Website Traffic Sources and What They Actually Mean
Organic search, paid search, direct, referral, social, and email. These six categories appear in every analytics platform, but each one hides more than it shows.
Organic search accounts for 53.3% of all website traffic globally, making it the single largest channel for most sites. It represents users who found you through a non-paid search result and have enough intent to click. That’s a meaningful signal. But calling it “free traffic” is a stretch: getting there requires sustained investment in content quality, technical infrastructure, and E-E-A-T signals that take months to compound.
Paid search sits at the other end of the spectrum. It’s fast, measurable, and completely dependent on budget continuity. Paid channels now account for nearly 42% of all traffic across the web, a figure that’s climbed as organic competition intensified. The average cost-per-click in paid search sits at $4.22, with high-intent verticals like legal pushing that to $6.75 or more. Stop paying, and the traffic stops the same day.
Organic Traffic vs Paid Traffic: Not the Same Race
The real difference isn’t cost, it’s the asset model. Organic search builds equity. A well-ranking article can generate traffic for years without incremental spend. Paid search is a rental agreement: excellent short-term returns, zero residual value.
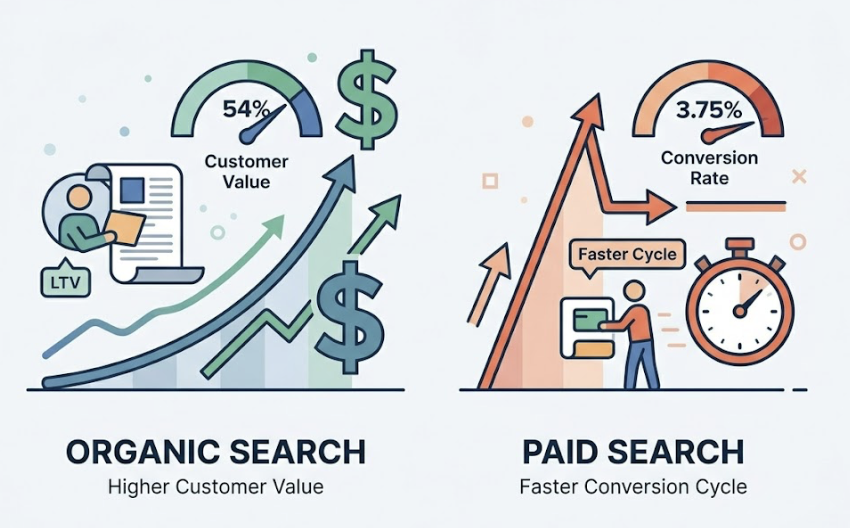
The financial case for organic is clearer over time. Organic traffic has a 54% higher lifetime value than paid traffic, largely because users arriving through search tend to have stronger purchase intent and deeper content engagement. That said, paid search delivers faster conversion cycles, with B2B paid search averaging a 3.75% conversion rate in the short term.
Neither is universally better. The question is what your business actually needs right now.
Direct Traffic vs Referral Traffic: Where the Confusion Starts
Direct traffic is supposed to represent users who typed your URL directly or used a bookmark. Referral traffic is supposed to represent clicks from other websites.
In practice, the line is much blurrier.
A significant portion of what shows up as “Direct” in Google Analytics isn’t brand loyalty at all. It’s attribution failure. And referral traffic, while smaller in volume, consistently delivers some of the highest conversion rates of any channel, often above 3%, because it carries the implicit trust of the source that linked to you.
Why Your Direct Traffic Number Is Probably Lying to You
Here’s the thing about direct traffic: it’s not a channel. It’s a catch-all.
Google Analytics classifies any visit without a referrer string as “Direct.” That sounds straightforward until you trace where those visits are actually coming from. A user clicks a link inside a WhatsApp group, the mobile app doesn’t pass referrer data, and GA4 records it as direct. Someone shares your article in a private Slack channel, their colleague clicks it on their phone, and again: direct.
This is dark social. According to RadiumOne, 84% of consumer online sharing happens in private channels like WhatsApp, WeChat, and Slack, with only 16% occurring on public social platforms. All of that private sharing, when it drives clicks, lands in your direct traffic bucket.
That’s not a minor data quality issue. In a controlled experiment tracking 16 subdomains, 100% of traffic from private messaging apps was recorded as direct. If your direct traffic is unusually high, the most likely explanation isn’t that you have a strong brand. It’s that your content is being shared in places your analytics can’t see.
Dark social traffic is also disproportionately valuable. Content shared privately is perceived as 3.2x more credible than content shared publicly, and dark social channels tend to produce 4 to 5x higher conversion rates than public social platforms. You’re not seeing garbage traffic in that “Direct” bucket. You’re seeing your most trusted referrals, mislabeled.
Social Media Traffic and Email Traffic: High Volume, Low Attribution
Social media drives volume. Email drives conversions. Both are chronically misattributed.
The core problem with social traffic is that most platforms don’t reliably pass referrer data when users click links inside native apps. A Facebook post click on mobile often drops the referrer entirely, sending the visit straight to Direct. Brands with structured UTM systems report 31% more accurate social attribution than those without, which tells you exactly how much data is leaking without proper tagging.
Email has the opposite profile. It’s one of the few channels where 1:1 attribution is genuinely achievable. When UTM parameters are applied consistently and user IDs are tied to email links, you can trace a specific subscriber’s journey from click to purchase with precision. 73% of B2B organizations rate email as their most effective lead generation channel, and the data backs that up: email-generated leads convert 67% better than social media leads.
That gap matters. Both channels require time and budget. But the conversion multiplier on email is hard to ignore.
How to Use UTM Parameters to Track Traffic Sources Accurately
UTM parameters are the GPS for traffic attribution. Without them, you’re guessing. A complete UTM structure includes five parameters: utm_source (where the click came from), utm_medium (the type of channel), utm_campaign (the specific initiative), utm_content (which creative or placement), and utm_term (for paid keyword tracking).
The most common failure isn’t missing UTMs. It’s inconsistent UTMs. When one team tags Instagram links as source=instagram and another uses source=ig, you end up with fragmented data that can’t be aggregated. A shared naming convention, enforced across every team that publishes links, is non-negotiable.
How to Compare Traffic Sources to Find Your Best-Performing Channel
Volume is the worst metric to optimize for first.
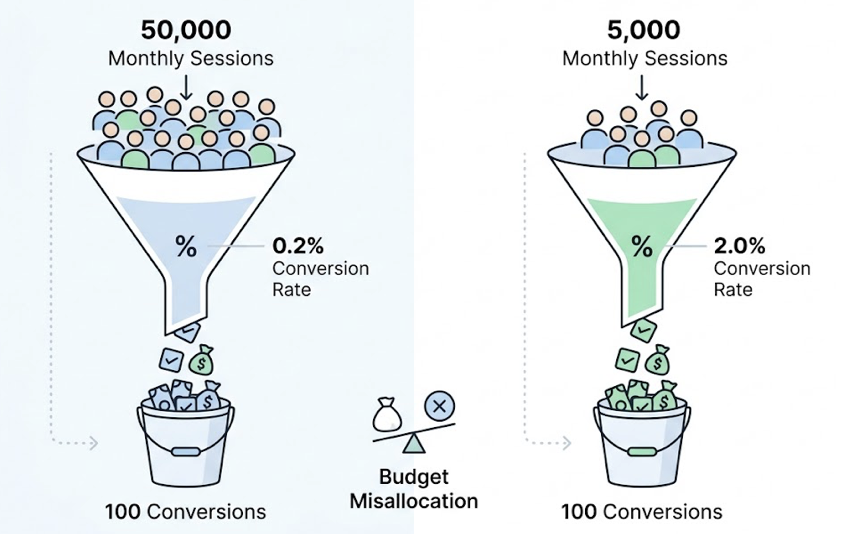
A channel with 50,000 monthly sessions and a 0.2% conversion rate generates 100 conversions. A channel with 5,000 sessions and a 2% conversion rate generates the same 100 conversions, at one-tenth the traffic cost. Optimizing for the first one while ignoring the second is exactly how marketing budgets get misallocated.
The right framework combines four dimensions: volume, intent, conversion rate, and scalability. Here’s how the six channels typically stack up:
| Channel | Volume | User Intent | Conversion Rate | Scalability |
|---|---|---|---|---|
| Organic Search | High | High | Moderate–High | Medium |
| Paid Search | Medium–High | Very High | High | Very High |
| Direct | Medium | Very High | Very High | Low |
| Referral | Low | High | High (often 3%+) | Low |
| Social Media | Very High | Low–Medium | Low (0.4–0.8%) | High |
| Medium | High | Moderate–High | Medium |
The goal isn’t to pick one winner. It’s to understand what each channel is actually for. Social at 0.4% conversion isn’t failing. It’s operating as a brand awareness channel. Expecting it to perform like direct traffic is the mistake.
The deeper financial metric is the LTV:CAC ratio. The ideal growth model targets a 3:1 LTV:CAC ratio, and not every channel gets you there. Paid search often wins on conversion speed but loses on retention, because intent-driven urgency doesn’t always translate to long-term loyalty. Organic and referral tend to produce customers who stay longer, which is why their lower short-term volume is often worth it.
Traffic Source Breakdown: A Practical Audit Process
Most marketing teams look at traffic dashboards weekly but audit the underlying data quality annually. That gap is where the mislabeled traffic accumulates.
Step 1: Reconcile your attribution model. Compare what your ad platforms report against what your CRM shows. Due to iOS privacy changes and browser restrictions, ad platform pixels miss between 30% and 50% of real conversions. If your ads dashboard shows 200 conversions but your CRM shows 120 closed deals from the same cohort, you have an attribution gap.
Step 2: Diagnose your direct traffic. Filter for “Direct” sessions landing on deep content pages like blog articles or product comparisons. If complex pages are showing up as direct, that’s almost certainly dark social or untagged email, not brand navigation. Homepage traffic being direct makes sense. Deep-content pages being direct usually doesn’t.
Step 3: Run a technical check. One underappreciated cause of referral misattribution: HTTPS-to-HTTP redirects strip referrer data entirely. If any pages still serve on HTTP, all referral traffic to those pages will appear as Direct. Check your SSL coverage across all subdomains and confirm your consent banner is correctly configured so that users who accept tracking are being tracked.
Step 4: Clean your UTM data. Pull a source/medium report for the past 90 days and look for variants of the same source spelled differently. Deduplicate and standardize. Build a shared UTM naming document that every team uses before publishing any link.
Step 5: Score channels on value, not volume. Use the four-dimension matrix above. Flag channels with high spend and low LTV for review. Identify referral sources that are small in volume but high in conversion. Those are partnership opportunities worth scaling.
Step 6: Build a monitoring cadence. Traffic attribution degrades over time as platforms change, tracking consent rules evolve, and link-sharing behavior shifts. A quarterly audit prevents six months of bad data from compounding into a year of bad decisions.
AI Search Is Now a Website Traffic Source. Most Analytics Tools Can’t See It.
This is the part most traffic source breakdowns miss entirely.
AI platform-driven referral traffic grew by 357% between June 2024 and June 2025. ChatGPT alone accounts for 87.4% of all AI referral traffic. Users are asking ChatGPT, Perplexity, and Gemini for product recommendations, and those platforms are linking out to brand websites in their answers.
That’s a real traffic source. But GA4 doesn’t have an “AI Search” channel.
Some of that traffic shows up under Referral, but inconsistently. ChatGPT’s paid subscribers often browse without passing referrer data, meaning the highest-intent AI users, the ones who pay for a premium tool and follow its recommendations, register in your analytics as Direct. You can’t see them. You can’t measure what AI said to send them.
The conversion quality is substantial. AI referral traffic converts at 5 to 23x the rate of traditional organic search. That’s because AI platforms function as recommendation engines: by the time a user clicks a link from a ChatGPT response, the AI has already completed an initial qualification pass. The user arrives with a formed opinion and high purchase intent.
On top of that, when AI Overviews appear in Google search results, organic CTR drops by 67.8%. Brands cited inside those AI Overviews, however, receive 35% more organic clicks than brands that don’t appear. Being visible in AI answers is no longer a future consideration. It’s already changing how traffic distributes across channels.
For teams that want to measure and optimize this channel, Topify tracks brand visibility across ChatGPT, Gemini, Perplexity, and other major AI platforms. Its AI Volume Analytics and Visibility Tracking surface which prompts are driving AI recommendations in your category, how often your brand appears in responses, and which domains AI platforms are citing as sources. In practice, this fills the attribution gap that every traditional analytics tool currently has when it comes to AI-generated traffic.
Get started with Topify to see where your brand stands across the AI channels your analytics dashboard can’t measure.
Conclusion
Website traffic sources haven’t changed in name. Organic, paid, direct, referral, social, email: those six categories still dominate every analytics report. What has changed is how much noise exists inside each label, and how consequential that noise is for decision-making.
Dark social is hiding your most trusted referrals inside your direct traffic. Missing UTMs are sending your best social campaigns to the same bucket. And a fast-growing, high-converting traffic source called AI search is either showing up as referral or not showing up at all.
The teams that win the next few years of traffic competition won’t be the ones with the highest volume. They’ll be the ones who actually know where their traffic is coming from, including the sources that today’s dashboards were never built to see.
FAQ
Q: How do I reduce reliance on paid traffic with organic growth?
A: Start by identifying which paid campaigns generate customers with the highest LTV, not just the highest conversion rate. Paid channels often win on short-term conversion but lose on retention. Build content assets targeting the same high-intent queries your paid campaigns cover, and shift budget incrementally as organic rankings improve. The transition typically takes 6 to 12 months before organic can offset paid volume, but the long-term cost structure is significantly better.
Q: How do I track dark social traffic that goes unattributed?
A: Add UTM parameters to every link you share, including in internal Slack channels, newsletters, and email outreach. For content you know gets shared privately, monitor for spikes in direct traffic to specific deep pages as a proxy indicator. Some teams use campaign-specific landing pages with unique URLs to make private sharing traceable. Full dark social attribution isn’t achievable without consent-based identity resolution, but structured UTMs eliminate the most preventable leakage.
Q: How do I attribute conversions to the right traffic source when users touch multiple channels?
A: Last-click attribution gives credit to the final touchpoint and systematically undervalues brand-building channels like organic social and display. Data-driven attribution, available in GA4, distributes credit across the full path. For B2B with longer sales cycles, a time-decay or position-based model often captures multi-touch reality more accurately. The key is picking one model and applying it consistently, then comparing channels using the same rules.
Q: How do I grow referral traffic through backlinks and partnerships?
A: Quality matters far more than volume. One link from a high-authority publication in your vertical delivers more SEO value than dozens of low-quality directory links. The most scalable approach is digital PR: producing data-driven or original research content that journalists and bloggers link to naturally. Direct partnership programs with complementary tools or services, where you cross-link in product documentation or resource pages, tend to produce referral traffic with strong conversion rates because the audience overlap is intentional. Companies with a structured link-building strategy earn 97% more inbound links than those without one.

