You’ve got GA4 set up. Maybe Hotjar on the side. Traffic numbers look fine. Conversions are holding steady.
But there’s a good chance 30% of your highest-intent visitors are showing up as “Direct” traffic — and you have no idea they were sent by an AI.
That’s not a GA4 bug. It’s a structural gap in how modern analytics was built. And in 2026, it’s costing marketers their most qualified leads.
Most Analytics Setups Still Have a 70.6% Blind Spot
When a user asks ChatGPT for a tool recommendation and clicks the link, that visit almost never arrives at your site with a referrer header intact. Mobile AI apps — running on iOS or Android WebViews — strip the metadata before the request even leaves the device.
The result: GA4 misclassifies up to 70.6% of AI-referred sessions as “Direct” traffic. In controlled testing, for every 56 visits originating from the Gemini app on iOS, GA4 correctly identified only 5 as referrals — a capture rate under 9%.
Here’s why that matters. AI-driven visitors convert at 14.2% to 15.9%. Standard organic traffic converts at 1.76% to 2.8%. You’re not just missing attribution data. You’re missing your best customers.
This isn’t an edge case anymore. It’s the primary measurement failure of 2026.
8 Traffic Analytics Tools, Ranked by What They Actually Measure
No single tool covers every channel. The analytics market in 2026 has split into general-purpose platforms for baseline measurement and specialized tools for deep behavioral and AI-specific insights. Here’s how the core stack compares:
| Tool | Core Function | Best For | Pricing (2026) |
|---|---|---|---|
| GA4 | Web/App Traffic Baseline | Ad sync, funnel tracking | Free / $50,000+ (360) |
| Adobe Analytics | Enterprise Customer Journey | Unsampled data, B2B attribution | $100,000+ /year |
| Matomo | Privacy-First Web Analytics | GDPR compliance, self-hosted | Free (self) / $23/mo (cloud) |
| Mixpanel | Event-Based Product Growth | SaaS retention and funnels | Free / $24+ /month |
| Heap | Auto-Capture Behavioral Data | UX friction, retroactive analysis | $2,000–$5,000+ /month |
| Hotjar | Heatmaps & Session Replay | Visualizing user struggle | Free / $32+ /month |
| Semrush | Competitive Intelligence | Traffic benchmarking, SEO | $139–$499+ /month |
| Topify | AI Search Visibility | LLM mention and citation tracking | $99+ /month |
The right stack depends on your org size and how mature your data culture is. That said, every team — regardless of size — now needs representation in at least three layers: traffic volume, user behavior, and AI visibility.
GA4: Still the Default, But No Longer the Whole Picture
Google Analytics 4 powers roughly 78.6% of the web analytics market as of early 2026. For most teams, it remains the foundation: event-based tracking, deep Google Ads integration, and a solid connection to Search Console make it hard to replace for baseline measurement.
Its limitations are real, though. Data sampling kicks in above certain session thresholds, and when it does, GA4 switches from processing raw events to statistical modeling. For retail clients, that gap has been shown to obscure seasonal patterns affecting up to 8% of revenue.
In the context of AI search, GA4 has no native capability to distinguish between a visit from standard organic results and one generated by Google’s own AI Overviews or AI Mode. That’s a gap no configuration workaround fully solves.
Use GA4 as your system of record for financial reporting. Don’t rely on it as a complete picture.
Google Analytics Alternatives Worth Considering
For teams with specific constraints, three alternatives consistently stand out.
Matomo is the privacy-first choice. It offers a self-hosted option that keeps EU user data entirely off US-based servers — a persistent compliance issue for GA4 and Adobe under GDPR and CCPA. Matomo includes cookieless tracking, built-in heatmaps, and A/B testing without third-party scripts. Healthcare and finance teams tend to favor it precisely because it reduces legal surface area without sacrificing data quality.
Mixpanel is built for product-led growth. Its event-based model goes deeper than GA4 on funnel analysis, retention cohorts, and user-level tracking — making it the better fit for SaaS teams who need to understand activation and churn patterns, not just traffic volume.
Heap takes a different approach: it auto-captures every user interaction by default, with no need to define events in advance. That retroactive flexibility is valuable when you realize, three months into a campaign, that you should have been tracking something you weren’t.
None of these replace GA4 entirely for teams already in the Google ecosystem. They’re best used as a layer on top of it, or as a direct replacement when compliance or product-depth requirements make GA4 the wrong fit.
What Heatmaps Actually Tell You That Numbers Can’t
Numbers show you what happened. Heatmaps and session recordings show you why.
GA4 can tell you a landing page has a 70% bounce rate. It can’t tell you whether users are leaving frustrated or leaving satisfied. Those two scenarios require completely different responses.
Hotjar and Microsoft Clarity (free, unlimited recordings) give you the behavioral layer. Clarity, in particular, has gained adoption fast in 2026 because its forever-free model removes the sampling limits that constrain Hotjar’s free tier. Both tools surface “rage clicks” on unresponsive UI elements and “dead clicks” on items that look interactive but aren’t.
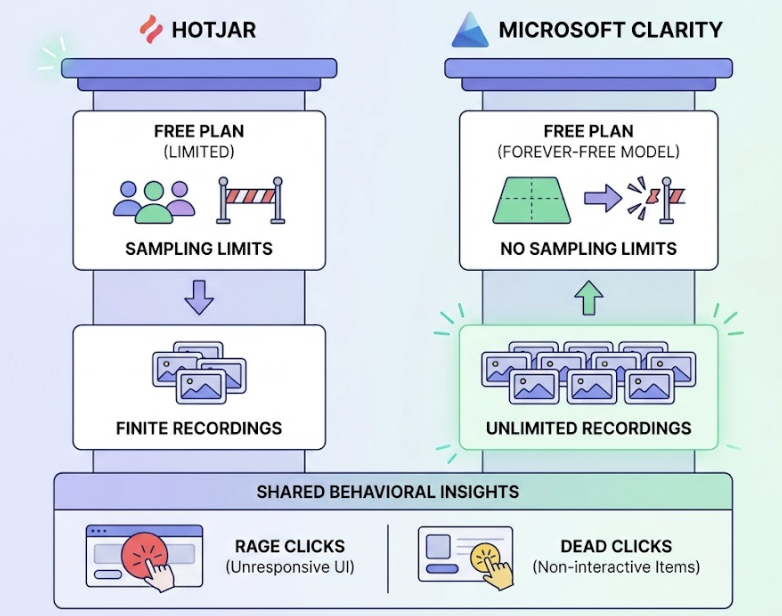
Average scroll depth across web content sits at 55% in 2026. That means half your page — and most of your CTAs — likely sits below where the average visitor stops scrolling. Behavioral tools are how you find that out before you lose another conversion cycle to a placement problem.
The workflow is simple: use GA4 to identify the pages with friction, then use Clarity or Hotjar to understand the friction itself.
Real-Time Monitoring and the Agency Dashboard Problem
Agencies in 2026 are expected to deliver real-time ROI visibility, not monthly spreadsheet drops. That shift has pushed a set of dashboard tools into standard practice.
Semrush Traffic Analytics remains the go-to for competitive benchmarking. It’s particularly useful for proving market share shifts to clients — showing not just how a client is performing, but how they’re performing relative to direct competitors across traffic sources.
For multi-client reporting, AgencyAnalytics and Databox serve different needs. AgencyAnalytics is built for the traditional PPC/SEO agency workflow, with white-labeling that lets clients log in to a portal on the agency’s own subdomain. Databox focuses on executive-level KPI scorecards, accessible on mobile, which tends to land better with client leadership who want a single number, not a full report.
Setting up a dashboard that actually drives decisions comes down to one principle: separate “Leadership” metrics (revenue, CAC, ROI) from “Managerial” metrics (CPL, CTR, engagement rate). Dashboards that mix both levels tend to get ignored by both audiences.
The Traffic Source Your Entire Stack Is Currently Ignoring
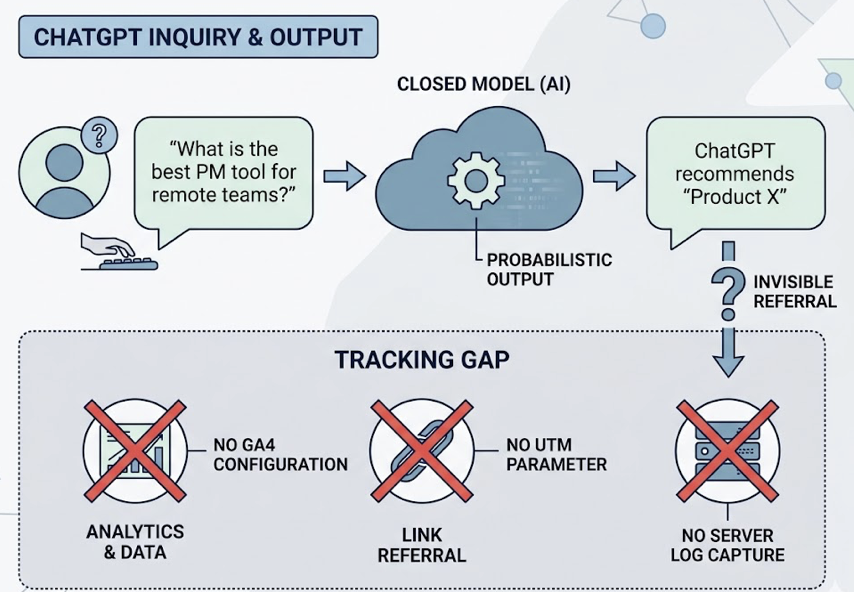
Here’s the thing: traditional web analytics tools are structurally incapable of monitoring what happens inside a generative AI model before a user clicks anything.
When someone asks ChatGPT “what’s the best project management tool for remote teams,” the search happens inside a closed model. If ChatGPT recommends your product, that recommendation exists as a probabilistic output, not an indexable page or a trackable referral. No GA4 configuration, no UTM parameter, no server log captures that moment.
ChatGPT alone sees 5.4 billion global monthly visits as of January 2026 — 64.5% of AI referral share. Google Gemini quadrupled its position between 2025 and 2026. Perplexity’s user base skews 30% senior leadership, making it one of the highest-value discovery channels per session. Claude, despite smaller volume, drives the highest conversion rate in the category at 16.8%.
That’s not marginal traffic. That’s where B2B decisions increasingly start.
Topify was built specifically to monitor this layer. It tracks brand presence across ChatGPT, Gemini, Perplexity, DeepSeek, and other major AI platforms through seven core metrics: visibility, sentiment, position, volume, mentions, intent, and CVR. Its AI Visibility Score measures the percentage of relevant category prompts that produce a brand mention. A score of 25 means your brand appeared in 25 out of 100 tracked prompts — a concrete number you can move over time.
The Sentiment and Positioning module is particularly important for brand managers. AI platforms sometimes describe products with outdated pricing, incorrect features, or misattributed comparisons. Topify surfaces these hallucinations before they influence a buyer’s decision.
On the citation side, research shows brands are 6.5 times more likely to be referenced by AI models through third-party sources — reviews, forums, industry publications — than through their own primary domains. Topify’s Source Analysisidentifies exactly which domains are driving AI recommendations, showing you where to build authority rather than guessing.
Topify’s Basic plan starts at $99/month and includes tracking across ChatGPT, Perplexity, and AI Overviews for up to 100 prompts and 9,000 AI answer analyses. It’s the entry point for teams that want to stop treating AI traffic as a black box.
How to Build an Analytics Stack That Covers Every Channel
The 3-layer model is the clearest framework for building a stack with no channel blind spots.
Layer 1: Foundational Traffic (GA4 or Matomo). This is your quantitative baseline — raw volume, source attribution, revenue. It’s the system of record for financial reporting and executive dashboards.
Layer 2: Behavioral Intelligence (Microsoft Clarity or Hotjar). This is your qualitative context — heatmaps, session recordings, rage clicks. It explains why the numbers in Layer 1 look the way they do.
Layer 3: Generative Discovery (Topify). This is your pre-click insight layer. It monitors brand presence in the AI models that are already influencing the “Direct” traffic you see in Layer 1, and gives you a lever to pull.
| Team Size | Layer 1 | Layer 2 | Layer 3 |
|---|---|---|---|
| Small Team | GA4 (Free) | Microsoft Clarity (Free) | Topify Basic ($99/mo) |
| Growth / SaaS | GA4 + Mixpanel | Hotjar | Topify Pro ($199/mo) |
| Enterprise / Agency | GA360 or Adobe | Heap or FullStory | Topify Enterprise |
For a mid-sized growth team, the total monthly investment in this stack typically runs $300 to $1,200. The ROI case is straightforward: AI search traffic converts at 5.1 times the rate of traditional search. Capturing even a 1% shift in AI discovery market share translates to a disproportionate revenue gain — because the visitors arriving from AI have already been pre-qualified by a model that evaluated your credibility before recommending you.
AI search traffic converts at 11 times the sign-up rate of standard organic traffic. If your analytics stack can’t see it, you can’t optimize for it.
Conclusion
The analytics tools that defined digital marketing for the past decade are still worth running. GA4, Hotjar, Matomo — these aren’t obsolete. They’re necessary but no longer sufficient.
The 30% blind spot in modern attribution isn’t a configuration error. It’s the gap between how measurement infrastructure was built and how users actually discover brands in 2026. Zero-click searches now account for 93% of interactions in Google AI Mode. The “click” — the event every analytics platform was designed around — is becoming a rare outcome rather than the default one.
The marketers who close that gap first will have a measurable advantage. They’ll know which AI platforms are recommending them, which sources are driving those citations, and which content gaps are letting competitors take their position. Everyone else will keep attributing their best customers to “Direct” and wondering why the numbers don’t add up.
FAQ
What’s the difference between Google Analytics 4 and Adobe Analytics?
GA4 is free and tightly integrated with Google Ads, making it the default for most teams. Adobe Analytics processes 100% of data without sampling and supports more complex attribution models, including B2B account-level tracking. The trade-off is cost: Adobe typically runs $100,000 to $300,000 per year, compared to GA4’s free tier. For teams where data completeness directly affects revenue reporting, the sampling gap in GA4 can justify the switch.
Is Google Analytics or Matomo better for privacy compliance?
For teams operating under GDPR or CCPA with strict data residency requirements, Matomo’s self-hosted option is the stronger choice. It keeps all data on your own servers, eliminates the legal complexity of EU-to-US data transfers, and supports cookieless tracking out of the box. GA4 has improved its privacy controls, but it’s still a US-based platform, which creates compliance friction for European organizations.
What are the best real-time website traffic tracking tools?
GA4 provides near-real-time data with a standard processing delay of a few hours for most reports. For true real-time competitive benchmarking, Semrush Traffic Analytics is the stronger option. For AI search visibility in real time, Topify monitors brand mentions across AI platforms on a continuous basis, which no traditional analytics tool supports.
What analytics tools work best for e-commerce traffic tracking?
E-commerce teams typically rely on GA4 for transaction-level tracking and Google Ads attribution, combined with a behavioral tool like Hotjar to identify checkout friction. For brands selling through AI-recommended discovery channels, Topify’s CVR (Conversion Visibility Rate) metric helps estimate how often AI recommendations are leading to purchase intent.
How do you track the user journey across multiple touchpoints?
Multi-touch attribution requires combining GA4’s data-driven attribution model with a CRM layer (HubSpot, Salesforce) that captures the full account journey. For B2B, Adobe Analytics offers account-level attribution that ties multiple sessions across buying group members to a single opportunity. The missing layer for 2026 is AI-assisted discovery, which sits before the first tracked touchpoint — that’s where Topify adds visibility that no traditional attribution model captures.
How can analytics tools help reduce bounce rate?
Bounce rate reduction starts with understanding whether a high bounce rate signals failure or success. GA4 identifies the pages; behavioral tools like Microsoft Clarity or Hotjar show you what users actually do on those pages. In many cases, users bounce after getting the information they needed — which looks identical to a frustrated exit in GA4. Session recordings distinguish between the two scenarios before you redesign a page that was actually working.
How do you get actionable insights from website traffic data?
The most common failure mode is collecting data without a decision framework. Separate your metrics into two tiers: leadership metrics (revenue, CAC, ROAS) and operational metrics (CPL, CTR, scroll depth). Every number should map to a decision someone is capable of making. If a metric can’t change a behavior or a budget, it doesn’t belong on your dashboard.

