
Your CFO asks how much to budget for GEO this quarter, and you have three numbers on hand: a market research firm’s TAM slide, last quarter’s spend plus 20%, or a figure your agency mentioned that nobody can defend under a follow-up question. None of these hold up once someone asks where the number came from. That’s the gap this framework closes. Not a market-size headline, but an input-by-input model you can walk into a budget meeting and actually defend.
Why AI Search Volume Breaks the Old TAM Math
Traditional TAM math for search marketing is simple: keyword volume times an assumed click-through rate times an average deal value. That formula depends on one thing being true, a query maps to a page, a page maps to a click.
AI search volume doesn’t work that way. A single user intent can spawn a stream of rewrites and follow-up prompts inside one conversation, and the assistant often answers without linking anywhere at all. There’s no click to count, which means there’s no CTR curve to multiply against.
The rewriting problem runs deeper than most teams expect. When Profound tested 10,000 prompts across ChatGPT, Copilot, and Perplexity, ChatGPT generated queries with only 13% word overlap against what the user actually typed. Perplexity stayed close to the original phrasing, Copilot landed in between. Map your keyword list directly onto AI prompts and you’re measuring the artifact of a different system, not the actual demand.
Intent also splits differently than keywords capture. The same research found that prompts naming a brand directly triggered a site-specific query 40% of the time, while open-ended prompts triggered one only 16% of the time. Same topic, two very different retrieval patterns. A keyword volume number flattens that distinction. A model built for AI search volume has to preserve it.

The Three Inputs Your AI Search Volume Model Needs
A working TAM model for GEO needs three inputs, and each one requires a different estimation method than the search volume tools you already know.
Prompt volume for the category. This is the total estimated number of AI queries touching your topic across a given period, not your exact keyword list, but the intent cluster it belongs to.
Platform distribution. Volume isn’t evenly spread. ChatGPT alone processes more than 2.5 billion prompts a day across roughly 900 million weekly active users, and that share shifts as Gemini, Perplexity, and AI Mode pick up more of the query load in different categories.
Capturable share. The realistic ceiling on how much of that volume your brand can plausibly appear in, based on your current citation footprint and content authority.
That third number is where most budget models quietly fall apart. Get it wrong and the whole formula produces a confident-looking figure that means nothing.
From Keyword Volume to Prompt Volume
Start with your existing keyword list and expand each term into three or four longer, conversational variants. Prompts inside AI assistants run far longer than search queries. SOCi’s 2026 Visibility Index found LLM queries averaging 23 words, roughly six times a typical Google search, and Semrush’s database of over 239 million prompts shows the same pattern holding at scale.
The expansion isn’t just about length. It’s about capturing constraints and context a keyword can’t hold, budget ranges, use cases, comparison framing. Each variant represents a slightly different retrieval path, and your capturable share can differ sharply between them.
Building the TAM Formula: A Working Example
Take a mid-market SaaS brand in project management software. Start with a category prompt volume estimate, say 40,000 monthly AI queries across the intent cluster once rewrites and variants are folded in. Apply a platform distribution weight, roughly 55% ChatGPT, 25% Gemini, 20% other assistants, based on where your buyer research shows up. Then apply a capturable share estimate based on current citation frequency, maybe 8% for a brand with modest existing authority.
That chain produces an estimated 3,200 monthly exposures your brand could realistically capture. Multiply by an assumed value per qualified exposure, drawn from your existing pipeline data, and you have a defensible range for what GEO investment is worth chasing.
The output is a range, not a headline number. Publishing an exact figure invites exactly the kind of challenge no model survives. As one analysis of AI search measurement put it, if you report 12,000 monthly prompts and a competitor’s tool says 800, you have a credibility problem you didn’t need. Report the range and the direction of change, not a single decimal-precision figure.
Where Most Budget Models Get the Denominator Wrong
Most models collapse two different things into one number: total mentions and total addressable demand.
Total mentions is how often your brand shows up across every AI answer touching your topic, regardless of whether that answer converts into anything. Total addressable demand is the volume of queries where a citation could plausibly lead to a business outcome.
Treating those as the same thing inflates the TAM and leads to budget requests that look impressive in a slide and fall apart against actual pipeline. Keep the denominator narrow, tied to intent clusters with commercial relevance, not every prompt that happens to mention your category.
Turning TAM Into a Defensible GEO Budget Number
Once you have a capturable exposure estimate, the conversion to budget follows a simple structure: capture rate assumption times value per exposure, benchmarked against what similar teams are actually spending.
Current benchmarks give you a sanity check. Enterprise marketing teams are allocating 8 to 15% of their combined search and content budget to AI search work in 2026, up from under 3% two years earlier. Forrester’s separate guidance recommends reallocating at least 15% of content or digital spend toward AI search visibility for B2B teams specifically. If your model produces a number wildly outside that range, that’s a signal to check your capture rate assumption before you present it.
The weak link in this whole chain is usually the prompt volume input itself, since most teams are working from a rough keyword extrapolation rather than actual AI query data. Topify’s AI Volume Analytics replaces that guesswork with volume estimates modeled directly from observed AI search behavior across ChatGPT, Gemini, Perplexity, and other major platforms, broken out by intent cluster rather than blended into one number.
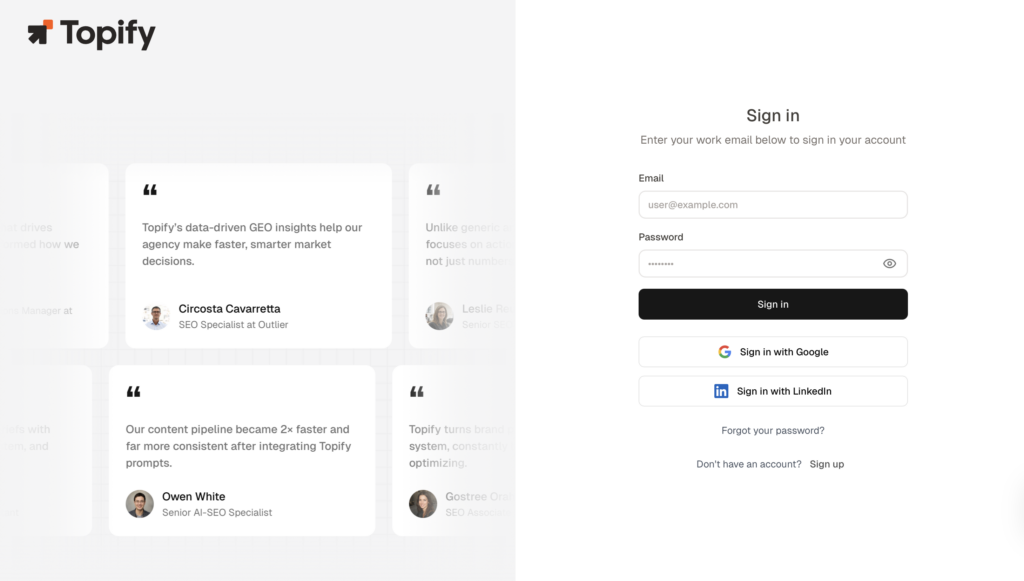
In practice, that means the first input in your TAM formula stops being an assumption and starts being a number you can point to when someone asks where it came from. Pairing that volume data with the platform’s visibility and position tracking also gives you the capturable share input from the same source, rather than stitching together two separate estimates.
How to Revisit This Model Every Quarter
AI search behavior shifts faster than a keyword database ever did. A model built in January can be stale by April if a new platform gains share or if prompt phrasing in your category shifts.
Monthly review works for most categories, though fast-moving ones like AI tools, finance, or consumer tech often need a tighter cadence. Watch for three triggers specifically: a new platform crossing meaningful usage share, a shift in how your category’s prompts are phrased, or a change in your own citation frequency that suggests your capturable share estimate is out of date.
Conclusion
The next time someone asks how much to budget for GEO, the answer isn’t a market-size slide or a percentage carried over from last year. It’s three numbers you can trace back to their source: prompt volume, platform distribution, and capturable share. Build the model once, revisit it quarterly, and you’ll walk into that meeting with a figure that survives the follow-up question.
FAQ
Q: How is AI search volume different from traditional keyword search volume?
A: AI search volume estimates demand across longer, conversational prompts and their rewrites, rather than fixed keyword strings. It also can’t be multiplied by a stable click-through rate, since AI assistants frequently answer without linking to any source.
Q: Can I calculate an exact TAM number for AI search demand?
A: No AI platform publishes prompt-level data, so every estimate is modeled from panels, sampling, or extrapolation. Treat the output as a directional range for prioritization, not a precise figure to publish.
Q: What percentage of budget should I allocate to GEO based on this model?
A: Current benchmarks put enterprise allocation between 8 and 15% of combined search and content budget, with some B2B guidance recommending 15% as a starting reallocation. Use your TAM model’s capturable exposure estimate to confirm your specific number falls in a reasonable range.
Q: How often should I rebuild this TAM model?
A: Monthly works for most categories. Fast-moving categories such as AI tools, finance, or consumer tech may need a tighter review cycle, since prompt patterns and platform share shift quickly in those spaces.