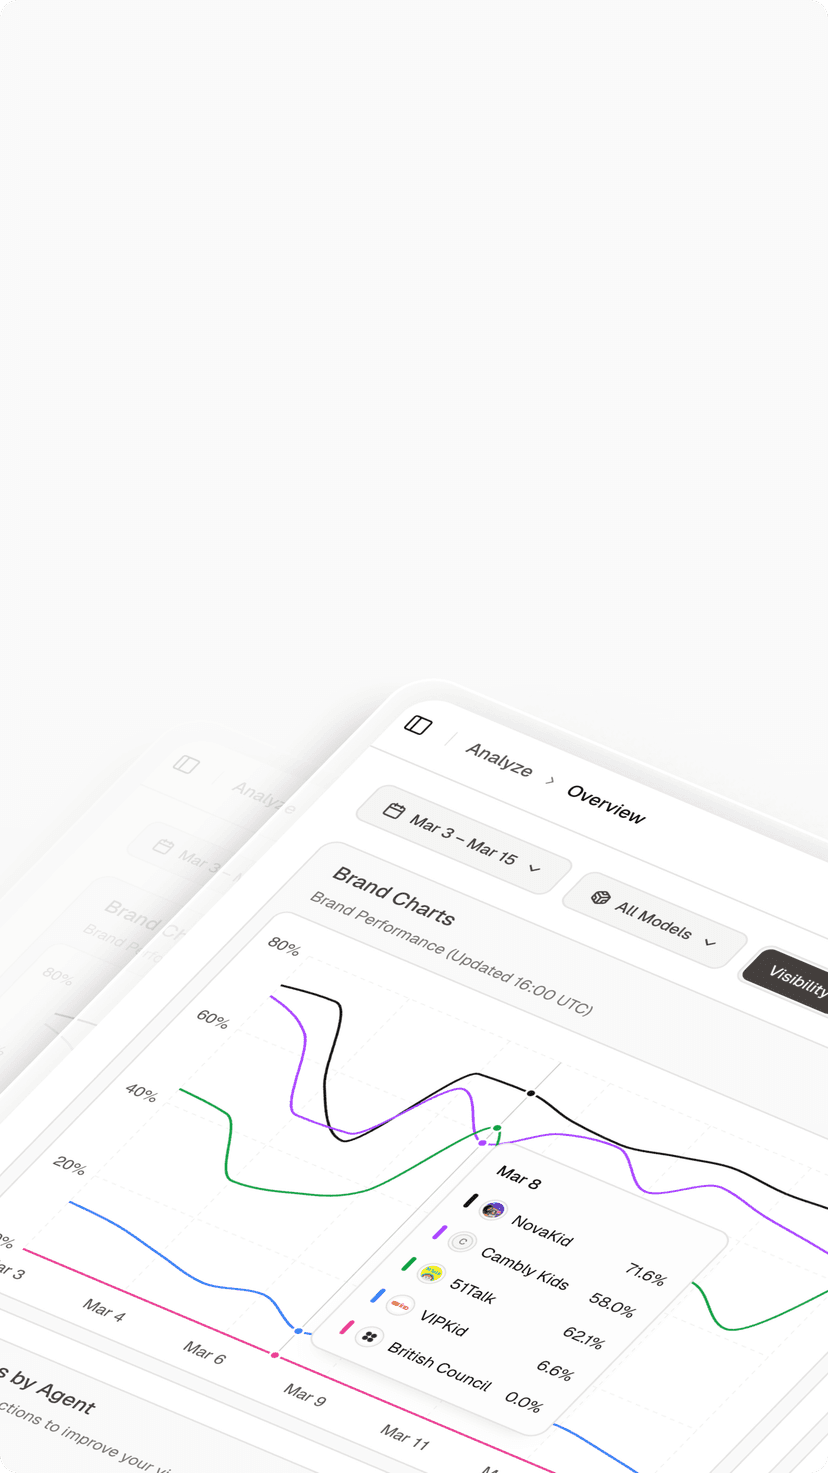

You open the quarterly review with a visibility chart that’s up 12 points. The room nods. Then your CMO asks what that number means for pipeline, and the honest answer is that you don’t have one. Three slides later she’s checking her phone. The tracking wasn’t the failure. The report was, because nothing on it answered a question anyone in that room was accountable for.
Your GEO Rank Tracker Isn’t the Problem. The Translation Layer Is.
Budget has already moved. Marketers now route roughly 24% of search and content budgets toward AI visibility work, and among 300 enterprise marketing executives surveyed by Search Engine Journal, 65% are allocating at least a quarterof their entire marketing budget to AI.
Measurement didn’t move with it. In the same survey, two-thirds said they were very confident in measuring outcomes, then 66% reported challenges with the basics of measurement when asked in more detail. Confidence and capability are running on separate tracks.
The gap shows up at the reporting layer, not the collection layer. Only 14% of marketers track AI visibility at all, and among those who do, Semrush found just 22% describe their SEO and AI search work as fully integrated across strategy, execution, and reporting. Reporting is the word that keeps falling off the end of that list.
So the constraint isn’t your GEO rank tracker. It’s that raw tracker output is written for the person who set up the prompts, and your CMO is not that person.
The First Page: Five Numbers, and Nothing Else
An executive report has one page that matters. Everything else is defense material for questions that may never come.
Put five rows on it:
| Row | What it shows | The question it answers |
|---|---|---|
| AI Visibility Score, 90-day trend | One weighted number across your priority prompt set | Are we gaining or losing ground? |
| Share of voice vs top 3 competitors | Your mention share against named rivals, by category | Is the gap widening or closing? |
| Platform split | ChatGPT, Gemini, Perplexity, AI Overviews as four bars | Where do we win, and where are we absent? |
| Sentiment mix | Positive, neutral, negative, qualified | Is AI describing us the way we position ourselves? |
| Attributable outcomes | AI referral sessions, AI-attributed conversions, branded search lift | What did this produce? |
Two of those rows carry most of the weight.
Share of voice is the one that survives scrutiny, because a number with a competitor next to it can’t be dismissed as noise. Semrush’s study of 481 marketers found 37% say competitors are mentioned more often than they are in AI answers. That’s a comparison your CMO already suspects is true and has no data on.
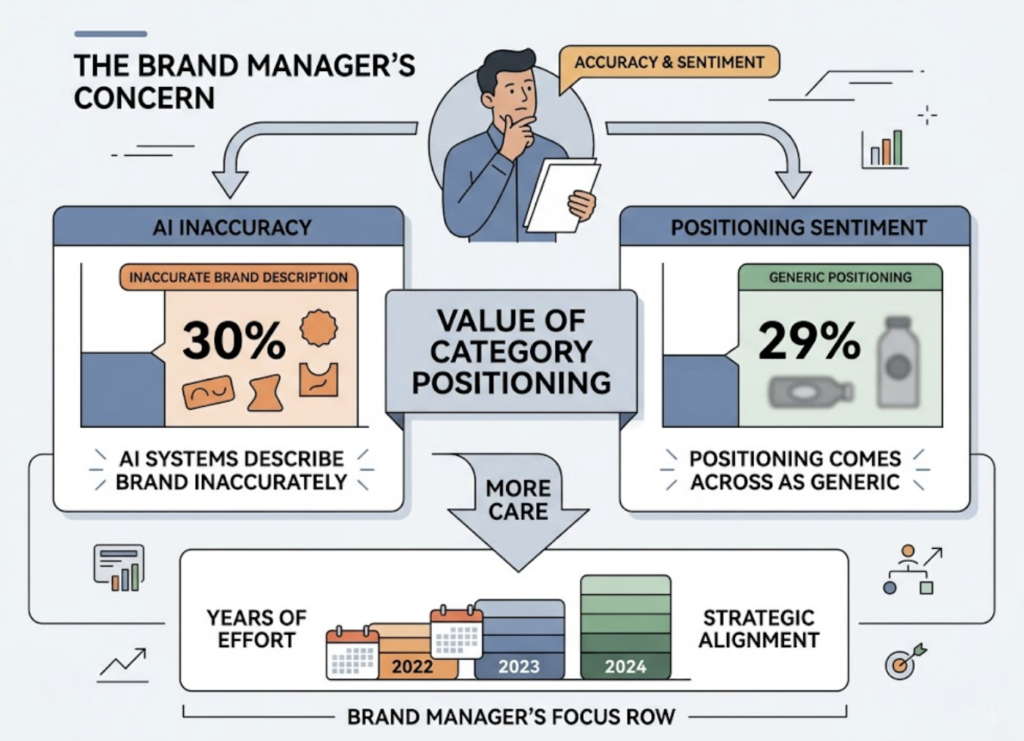
Sentiment is the second, and it’s usually underplayed. In the same study, 30% reported their brand is described inaccurately by AI systems and 29% said their positioning comes across as generic. A brand manager who has spent two years on category positioning will care more about that row than about any score.
Flag any category where negative or qualified mentions exceed 10% of total mentions. That’s the threshold worth escalating.
What Belongs in the Appendix, Not the Headline Row
Here’s the filter that keeps executive trust intact: if finance can’t tie a metric to a dollar, it doesn’t belong in the headline row. Raw mention counts, per-prompt screenshots, single-day scores, and unweighted prompt coverage all fail that test. They belong in the appendix, where they’ll do their real job of answering follow-up questions.
The cost of getting this wrong isn’t a boring meeting. It’s cumulative. Only 32% of CEOs currently trust their CMOs, and 34% of Fortune 500 companies have removed the CMO role from the C-suite entirely. Your report is one input into that dynamic, and a page of impressive-looking activity metrics pushes in the wrong direction.
The Spring 2026 CMO Survey puts a number on the pressure your CMO is passing down. Marketing leaders rate their partnership with the CFO at 4.8 on a 7-point scale for growth planning, and the case-building score has crept from 4.3 to 4.5 over four years. Your CMO isn’t asking about revenue to be difficult. She’s asking because someone is asking her.
Translating AI Visibility Into Revenue Language
The conversion data is the strongest card you have, and most reports leave it in the deck.
AI referral traffic is small. Conductor’s study across 13,770 domains put it at roughly 1.08% of total sessions. If you lead with volume, you lose.
Lead with quality instead. Semrush’s research across 500-plus high-value topics found AI search visitors converting at 4.4x the rate of traditional organic visitors. Ahrefs published its own numbers showing 0.5% of sessions from AI platforms driving 12.1% of all signups. In Seer Interactive’s multi-vertical data, ChatGPT referrals converted at 15.9%against 1.76% for Google organic.
The mechanism is worth saying out loud in the meeting, because it’s what makes the multiple believable: the AI answer does the shortlisting before the click. By the time someone arrives, they’ve already been pre-qualified by the model.
One more line for context. Conductor pegs ChatGPT at roughly 87.4% of average AI referral traffic across industries. If your platform split shows you strong on Perplexity and weak on ChatGPT, that’s not a balanced scorecard. That’s a concentrated risk, and it’s worth naming as one.
The Volatility Problem Your CMO Will Find Before You Do
AI answers are not stable, and your report has to say so before someone else discovers it.
AirOps found that only 30% of brands stay visible from one answer to the next, and just 20% remain visible across five consecutive runs of the same prompt. A single run tells you almost nothing. A month of runs tells you something real.
That leads to three reporting rules worth adopting permanently:
Report trends, never single points. A 90-day line with a stated sample size is defensible. A screenshot from Tuesday is not.
Disclose the sample. How many prompts, how many runs per prompt, which platforms, over what window. One sentence in the footer. It costs you nothing and it’s the first thing a skeptical CFO will ask for.
Reset the baseline when models change. A platform’s model update can shift citation behavior across your whole prompt set. When that happens, annotate the chart rather than explaining the dip verbally three weeks later.
Volatility disclosed is credibility. Volatility discovered is a problem.
Say the Attribution Gap Out Loud
Most AI-driven visits don’t identify themselves. Analysis of 446,000 visits found 70.6% of AI traffic landing as “Direct”in GA4, because the user read your name inside a chat interface, opened a new tab, and typed your URL.
That means your AI-attributed conversion row is a floor, not a total. Say exactly that in the footnote.
Teams hide this because it feels like admitting weakness. It’s the opposite. A report that overstates attributable outcomes gets audited once and never trusted again. A report that states its own floor and shows branded search lift alongside it survives the audit.
Pair the referral number with branded search volume and direct traffic trend. When all three move together and your visibility score climbs, you have a correlation story that holds up in a room full of people who don’t take single-source numbers at face value.
Where a GEO Rank Tracker Earns Its Line Item
The five-row first page only works if one system produces all five numbers on the same sampling basis. Stitching visibility from one tool, sentiment from a second, and competitor data from a spreadsheet gives you five numbers that can’t be compared to each other.
That’s the practical case for consolidation. Topify tracks seven metrics across major AI platforms in a single view: visibility, sentiment, position, volume, mentions, intent, and CVR. The mapping to an executive page is close to one-to-one. Visibility feeds the trend line, position and mentions feed share of voice, sentiment feeds the description row, and CVR carries the conversion likelihood argument that most dashboards leave to the analyst’s judgment.
Competitor coverage is what makes the chart defensible rather than self-reported. Dynamic competitor benchmarking detects which brands AI engines recommend in your category and tracks your position against them over time, which turns “our score went up” into “we closed four points of gap on the two rivals your board already knows by name.”
Then there’s the question every report should be able to answer: why did the number move? Citation-level analysis shows the exact domains and URLs AI platforms pulled from, so a drop traces back to a specific source that stopped citing you rather than a shrug. Platform coverage spans ChatGPT, Gemini, Perplexity, DeepSeek, Doubao, Qwen, and others, which matters if your market isn’t only North America.
Plans start at $99 per month for 100 prompts and 9,000 AI answer analyses, with the $199 tier moving to 250 prompts and 22,500 analyses. Full details are on the pricing page. Against a search budget where a quarter is already flowing to AI visibility, the tracking line item is rarely the number a CFO objects to. The missing report is.
If you want to establish a rough baseline before committing budget, a set of free GEO tools will get you a first read, and you can start tracking properly once you know which prompts matter.
Make the Report End With a Decision, Not a Chart
The most common failure mode isn’t a bad number. It’s a report that gets circulated, skimmed, filed, and changes nothing about what the content team publishes next month.
Close every report with three lines:
- What we’re doing this quarter, tied to a specific gap in the data
- What we’re stopping, because it hasn’t moved a tracked metric in 90 days
- What success looks like next quarter, stated as a number before the quarter starts
Monthly cadence for the working team, quarterly for leadership. The monthly version can be one page of the five rows plus a changelog. The quarterly version adds the revenue translation and the decisions.
Bottom line: your CMO doesn’t need to understand how a GEO rank tracker works. She needs to walk out of the room able to defend a budget line with three sentences.
Conclusion
The report that dies on slide three isn’t failing because the data is weak. It’s failing because it was written for the person who built the prompt set instead of the person who has to defend the spend.
Fix it in this order. Cut the first page to five rows. Put a competitor name next to your score. State your sample size and your attribution floor before anyone asks. End with a decision instead of a chart.
Do that once and the quarterly review stops being a defense of the channel. It becomes the meeting where the channel gets funded.
FAQ
Q: What should a GEO rank tracker report include for executives?
A: Five things on the first page: a weighted visibility score with a 90-day trend, share of voice against your top three named competitors, a platform-by-platform split, sentiment mix, and attributable business outcomes. Everything else belongs in an appendix.
Q: How often should we report AI search visibility to leadership?
A: Monthly for the working team, quarterly for leadership. AI answers shift week to week, so weekly executive reporting tends to surface noise rather than signal. The monthly version keeps the working team responsive without pulling leadership into volatility.
Q: How do we connect AI visibility to revenue?
A: Report AI referral sessions and AI-attributed conversions alongside branded search lift, and state clearly that the referral number is a floor because most AI-driven visits arrive without a referrer. Published studies put AI referral conversion rates several times higher than organic, so the argument is about traffic quality rather than traffic volume.
Q: Is AI share of voice a vanity metric?
A: Not when it’s competitive and category-scoped. A raw mention count is a vanity metric because it has no reference point. Share of voice against three named competitors in a defined category is a market-position metric, and it’s typically the most defensible number on the page.