
You priced it out already. A hundred prompts, four AI engines, a scheduled job, and a Postgres table. The token bill came back under $150 a month, which is less than one seat on most analytics platforms, and the whole GEO rank tracker looked like a two-week sprint you could slot in between roadmap items.
That estimate isn’t wrong. It’s just measuring the cheapest part of the system.
The expensive parts are statistical validity, entity resolution, and the fact that what you’re measuring shifts underneath you every few weeks. Here’s the full bill, line by line, including the items that never appear on a credit card statement.
The Napkin Math That Makes a DIY GEO Rank Tracker Look Cheap
The estimate almost always looks the same. Take your prompt list, multiply by the number of engines, multiply by how often you want to check, then multiply by a per-call token price.
At current rates that math genuinely is small. OpenAI’s mid-tier model runs $2 per million input tokens and $12 per million output, and a typical brand-recommendation answer is maybe 700 output tokens. That’s less than a cent per call.
So the spreadsheet says $60 a month and the meeting ends.
The problem isn’t the arithmetic. It’s that the arithmetic prices one question asked once, and a tracker that anyone will act on has to do something considerably harder than that.
What a GEO Rank Tracker Has to Do Before Anyone Trusts Its Output
Asking an AI engine a question is one function call. Turning thousands of those answers into a number a marketing lead can defend in a QBR takes six separate systems.
Prompt set design. Which questions represent real buyer intent in your category, and how many paraphrases of each do you need? This is a research problem, not an engineering one.
Multi-engine querying. ChatGPT and Claude have clean APIs. Google’s AI Overviews and AI Mode don’t, so you’re routing through a third-party SERP provider with its own failure modes.
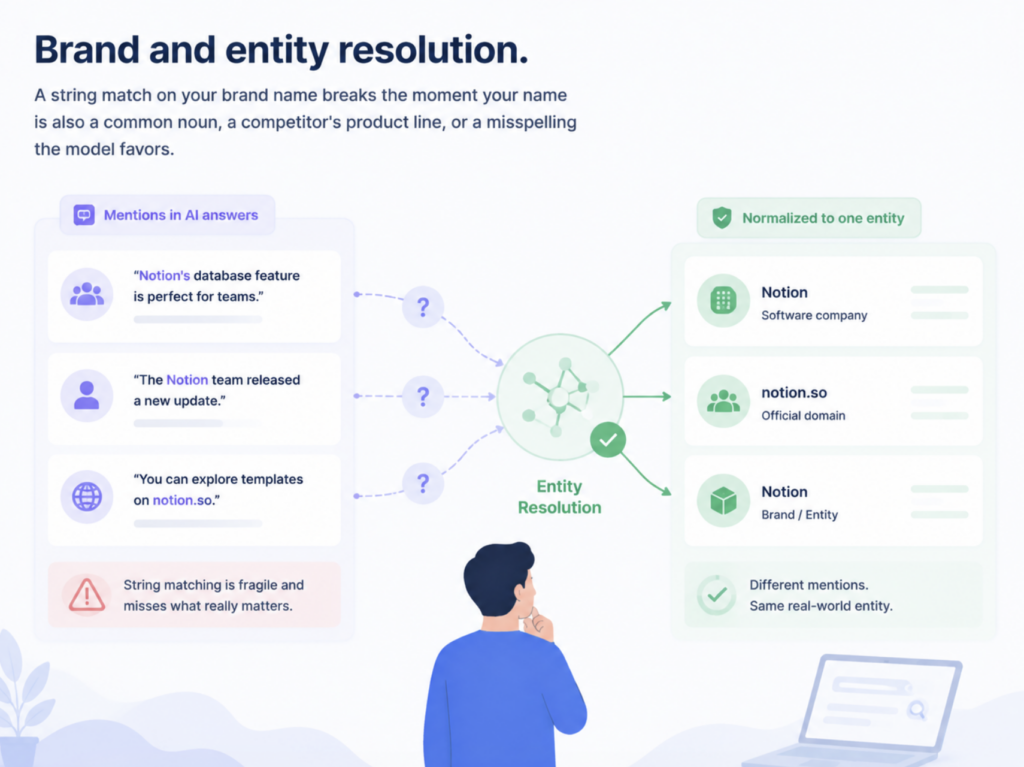
Brand and entity resolution. A string match on your brand name breaks the moment your name is also a common noun, a competitor’s product line, or a misspelling the model favors. Mentions arrive as “Notion’s database feature,” “the Notion team,” and “notion.so” in the same answer set.
Position and sentiment scoring. Was your brand first, third, or a footnote qualified with “though it’s pricier than alternatives”? Both need a second LLM pass, which means a second token bill and a second source of variance.
Citation parsing. Which domains did the engine actually cite, and did any of them belong to you? This is where most homegrown trackers stop, because it requires normalizing wildly inconsistent source formats.
Longitudinal storage. Every one of the above has to stay comparable to itself across months, or the trend line means nothing.
Each of those is a module. Not an if-statement.
API Costs Are the Smallest Line on the Bill
Run the numbers at a realistic configuration and the API layer still comes in modest, but it’s meaningfully higher than the napkin version because of the surfaces you can’t reach with an LLM API alone.
Perplexity’s Sonar bills $1 per million tokens each way plus a per-request search fee of $5 to $14 per 1,000 requests, and its standalone Search API sits at $5.00 per 1,000 requests. Google AI Overviews require a SERP vendor, where prices run from about $0.30 to $25 per 1,000 searches depending on how much structured parsing you want. The same benchmark found DataForSEO’s AI Overview endpoint around $1.20 per 1,000.
Pick your vendor carefully, though. One head-to-head test found that three major scraping providers returned zero AI Overview data despite selling Google SERP access, which means a pipeline built on them has to be rebuilt later.
A realistic monthly total for 100 prompts across four engines, checked weekly, lands somewhere between $55 and $125. Call it $1,000 a year.
The Sampling Multiplier Nobody Puts in the Estimate
Here’s where the napkin math quietly breaks. One call per prompt per engine tells you almost nothing, because AI answers aren’t stable.
SparkToro and Gumshoe.ai ran 2,961 prompts across ChatGPT, Claude, and Google’s AI with 600 volunteers, repeating each prompt 60 to 100 times per platform. The odds of getting the same brand list twice came in under 1 in 100. The odds of getting it in the same order were closer to 1 in 1,000.
What did hold up was frequency. The top brands in each category appeared in 55% to 77% of responses regardless of phrasing, which is why visibility percentage survives scrutiny and single-run “rank” doesn’t.
That finding rewrites your cost model. If a defensible number needs dozens of runs rather than one, every API figure above multiplies accordingly.
And repetition alone won’t save you. A variance-components study of non-determinism in LLM brand answers found that a sixth repeat of the same prompt reduces relative-error variance by only 0.0003, while brand-ranking reliability sits near 0.01 for a single answer and reaches only about 0.36 across a full crossed design of eight languages, three models, and fifteen paraphrases. Reliability comes from spreading across models, languages, and phrasings, not from hammering one prompt.
Separate research on paraphrase brittleness puts a sharper edge on it: two natural paraphrases of the same buyer intent produced recommendation sets overlapping just 14% to 29%, against 50% to 61% for reruns of the identical prompt. The phrasing your tracker happens to issue becomes the dominant variable in your own metric.
So the honest API estimate isn’t 100 prompts. It’s 100 intents times several paraphrases times several runs times four engines. That’s a 15x to 30x multiplier on the number your spreadsheet started with.
The Line Item You Can’t Put on a Credit Card
Even at 30x, the API bill stays under $2,000 a year. Engineering time is where the money actually goes.
Industry cost modeling puts a blended loaded cost across engineers, PM, and UX at around $230,000 per FTE per year. A single developer typically runs $120,000 to $180,000 fully loaded once benefits and overhead are counted. A production-grade internal tool with auth, logging, error handling, and a usable interface generally takes three to six months and $150,000 to $400,000 before anyone logs in.
A GEO tracker is narrower than that, so scale it down. Six to twelve weeks of one competent engineer, plus review time, lands in the $25,000 to $60,000 range for a v1 that produces charts you’d show a client.
Then it never stops. The same modeling puts ongoing maintenance at 20% to 30% of the original build cost annually, and broader research finds that maintenance consumes more than half of a system’s lifecycle cost, with some platform engineering estimates putting it at 70% to 80% of lifetime cost.
Your real recurring bill isn’t tokens. It’s an engineer, every month, forever.
Why a Self-Built GEO Rank Tracker Drifts Out of Sync Within a Quarter
This is the failure mode that turns a working tracker into a decorative one, and it has nothing to do with code quality.
Models get retired. Providers typically give a frontier model a lifespan of roughly 12 to 18 months before deprecating it, and every provider maintains a running deprecations page with retirement dates attached. Microsoft’s Foundry documentation goes further, publishing a formal model retirement schedule and lifecycle status codes so integrations can be migrated before they start returning errors.
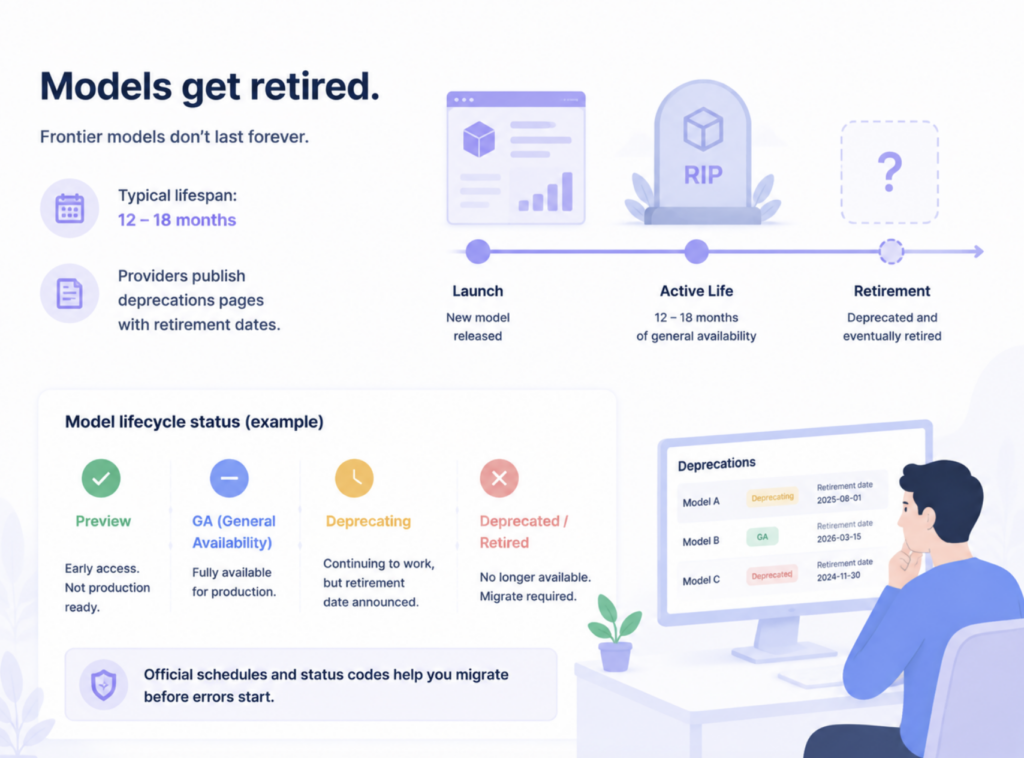
When the model under your tracker changes, your baseline changes with it. The visibility drop you see in month five might be a real competitive loss, or it might be the new model version. You have no way to tell them apart, because the only control you had was the model itself.
Answers are also conditioned on who’s asking. A cross-provider audit of persona conditioning sampled 2,000 runs across ten personas and found that the same prompt produces materially different recommendation sets depending on the buyer context the model infers, with the effect concentrated in mid-market. If your tracker issues every query as a context-free string, it’s measuring one narrow slice of reality and reporting it as the whole picture.
The compounding problem is that once your time series breaks, every dollar you already spent producing it loses its analytical value. You don’t get to compare Q1 to Q3.
DIY GEO Rank Tracker vs. Managed Platform: The 12-Month Numbers
Put the two paths side by side over a first year, using conservative figures on the build side.
| Cost line | Build it yourself | Managed platform |
|---|---|---|
| Initial engineering | $25,000 to $60,000 | $0 |
| LLM and SERP API spend | $700 to $2,000/year | Included |
| Maintenance and rework | 20% to 30% of build cost annually | Included |
| Model migration work | Recurring, unpredictable | Handled upstream |
| Engine coverage | Whatever you wire up and maintain | Multi-engine by default |
| Metrics produced | Mention counts, maybe position | Visibility, sentiment, position, volume, mentions, intent, CVR |
| Citation-level source data | Usually skipped | Built in |
| Historical continuity | Breaks on model or vendor change | Maintained across versions |
| Year-one total | Roughly $32,000 to $95,000 | $1,188 to $2,388 |
For reference on the right-hand column, Topify prices its Basic plan at $99 a month with 100 tracked prompts and 9,000 AI answer analyses, and Pro at $199 a month with 250 prompts and 22,500 analyses. Full pricing sits on the Topify pricing page.
The gap isn’t close. It’s roughly 15x to 40x, and the DIY column buys you fewer metrics.
When Building Your Own GEO Rank Tracker Actually Makes Sense
Buying isn’t automatically correct, and pretending otherwise would be dishonest. Three situations justify the build.
You’re doing research, not marketing. If the output is a paper or an internal study rather than a monthly report, you need methodological control that no vendor will expose. Custom sampling designs, specific model versions, controlled persona variables.
You already have the infrastructure. If your team runs data pipelines with scheduling, storage, and observability already solved, the marginal cost of one more pipeline is much lower than the numbers above suggest.
Your entities aren’t standard. Tracking internal product codenames, regulated terminology, or a private corpus alongside public AI answers is genuinely outside what a general platform handles.
Three signals point the other way. If nobody on the team owns the tracker as a named responsibility, it will rot. If the output has to be client-facing within a quarter, you’ll ship a prototype and present it as data. And if you can’t articulate your sampling design in one sentence, you’re not building a measurement system. You’re building a screenshot generator.
What You’re Buying When You Skip the Build
The thing worth paying for isn’t the dashboard. Dashboards are the easy part, and an engineer can produce a passable one in a week.
What’s hard is consistent measurement methodology maintained across model changes, plus the historical continuity that makes any of it comparable over time. That’s the part a self-built tracker loses first and notices last.
For teams tracking visibility across multiple engines, Topify covers the seven-metric picture in one place: visibility, sentiment, position, volume, mentions, intent, and CVR across ChatGPT, Gemini, Perplexity, DeepSeek, and other major engines. In practice, that means you can spot a mention drop in one engine and trace it to a specific source domain that stopped citing you, without joining three tables by hand.
Two capabilities in particular tend to be the ones DIY builds never reach. Competitor benchmarking runs the same prompt set against rivals automatically, so position is measured relative to a live set rather than against your own history. And citation analysis reverse-engineers which exact domains and URLs the engines are pulling from, which is the difference between knowing your visibility fell and knowing which publication to pitch next.
There’s also a prompt discovery layer that surfaces high-volume queries in your category as recommendations shift, which is the research problem from section two, handled as a feature rather than a quarterly manual exercise.
You can start with Topify on a single project and validate the data against whatever spot checks you’d run manually.
Conclusion
Go back to that first spreadsheet. The token math was right, and it was also measuring maybe 3% of the total cost of a working GEO rank tracker. The other 97% is engineering time you can’t invoice, sampling design that determines whether your numbers mean anything, and continuity that breaks the first time a model gets deprecated.
If you’re a research team with infrastructure and a methodology to defend, build it. If you need a number your CMO can act on next month, the honest comparison isn’t $150 a month versus $199 a month. It’s $32,000 versus $2,400, with fewer metrics on the expensive side.
Run the 12-month table with your own loaded engineering cost before the next planning cycle. The answer usually stops being ambiguous once the FTE line is in the sheet.
FAQ
Q: What’s the realistic minimum monthly API cost for a DIY GEO rank tracker?
A: For 100 prompts across four engines checked weekly at a single run each, roughly $55 to $125 a month. Once you add the paraphrase and repetition sampling that makes the data statistically meaningful, expect that figure to multiply 15x to 30x, landing between $1,000 and $2,000 a year.
Q: How many runs per prompt do I need before the data is reliable?
A: Research points to 60 to 100 runs per prompt per platform for stable visibility percentages. But repetition alone hits diminishing returns fast, and reliability improves more from varying paraphrases and models than from repeating a single prompt.
Q: Can I just track ChatGPT and skip the rest?
A: You can, and it’s the cheapest path since it needs only one clean API. The tradeoff is that brand recommendation sets differ meaningfully across engines, so a single-engine tracker reports one slice of your visibility as though it were the whole number.
Q: Can I migrate data from a self-built tracker into a platform later?
A: Partially. Raw answer logs usually import fine as historical reference, but computed metrics rarely reconcile, because your scoring logic and the platform’s won’t share definitions. Most teams treat the switchover as a new baseline rather than a continuous series.