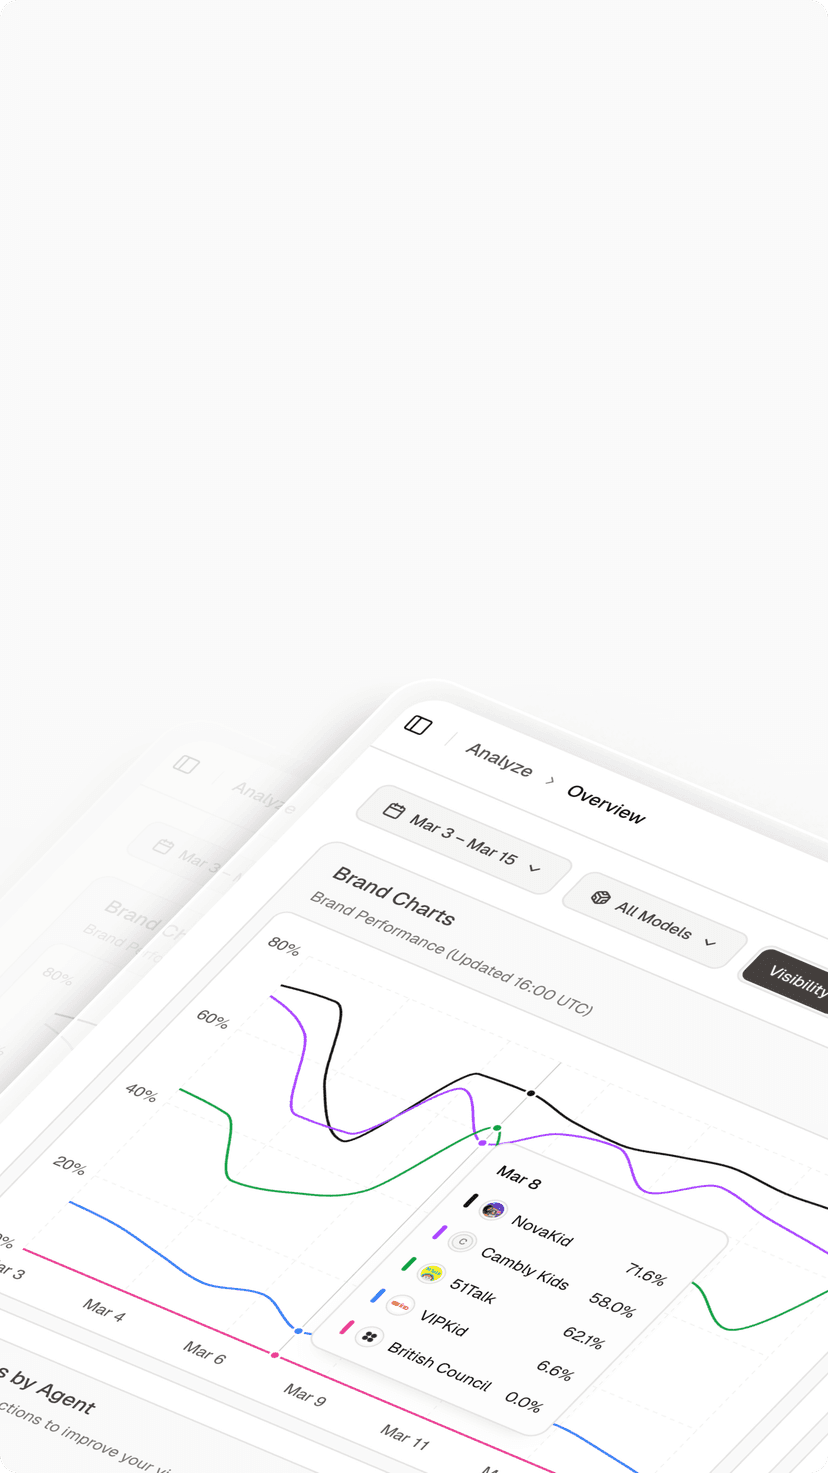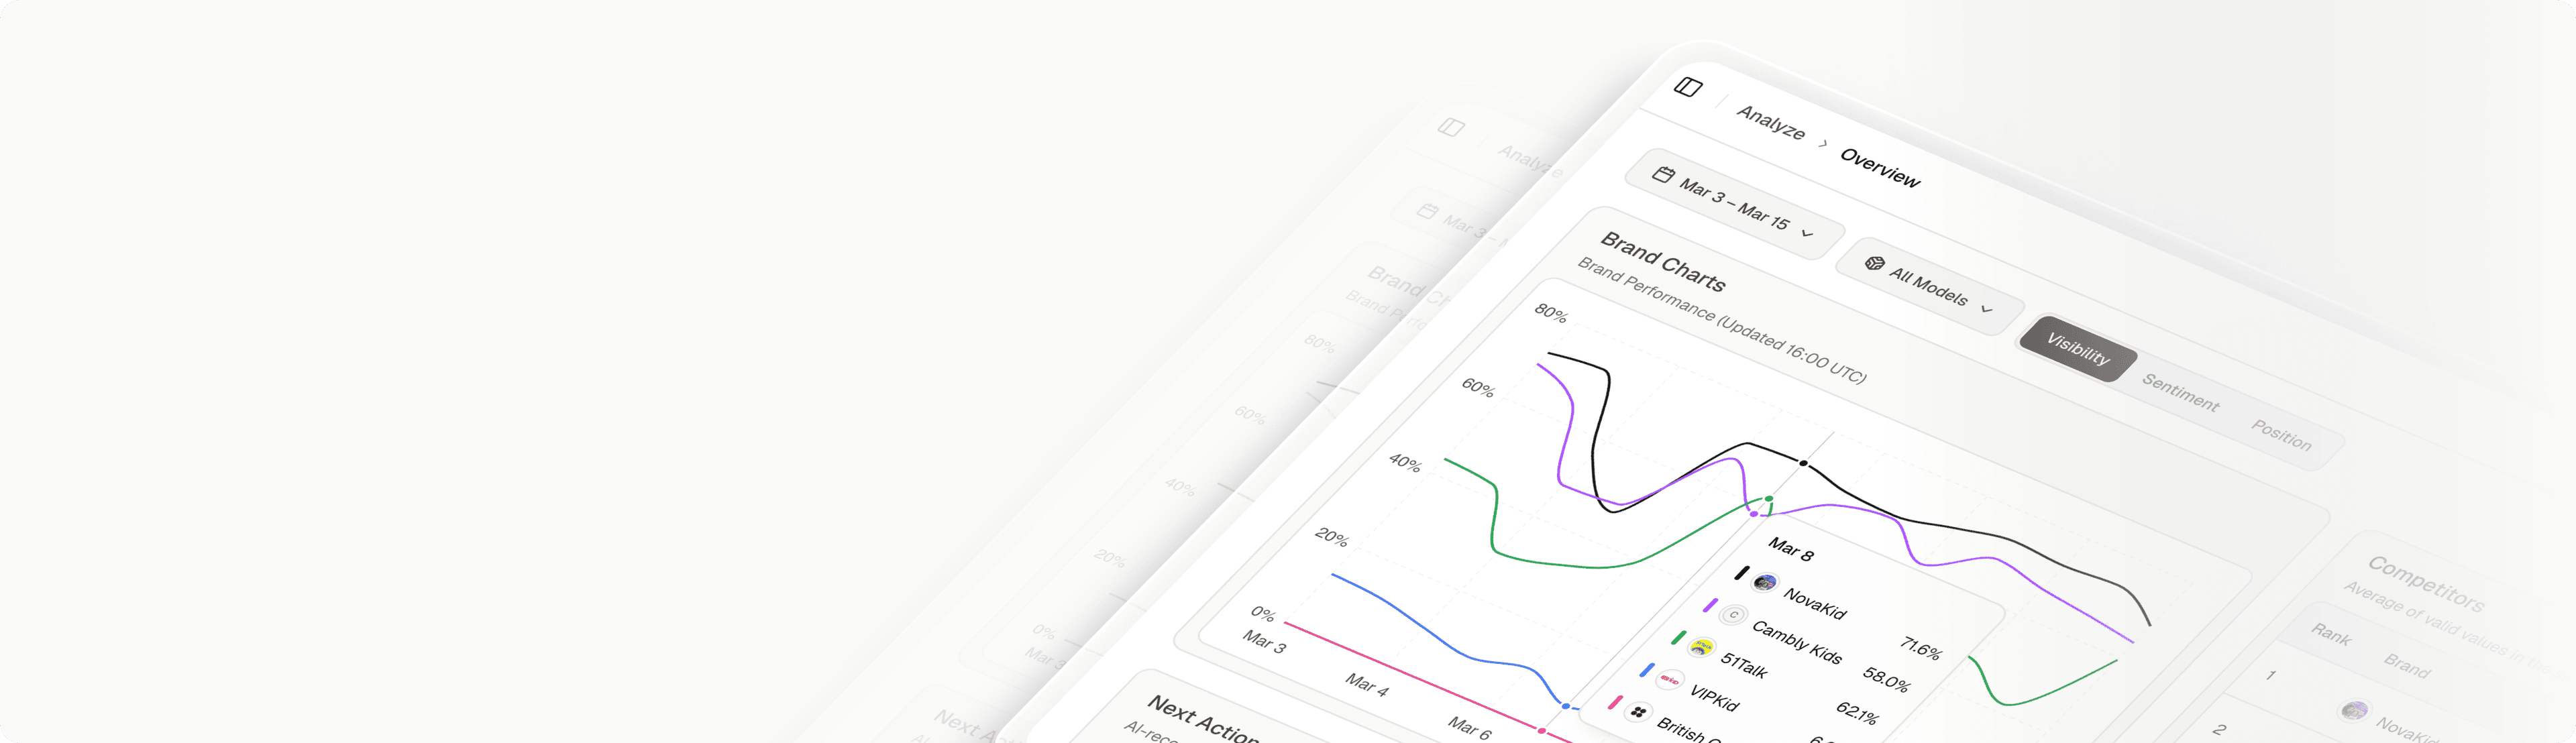

The first attempt usually looks like this: someone on the team opens ChatGPT, types “best tools for [your category],” screenshots the answer, and pastes it into Slack. Your brand shows up. Two weeks later, someone repeats the exercise and you’re gone. No one knows why, no one knows when it changed, and there’s no baseline to compare against.
That’s not tracking. That’s guessing with screenshots.
AI answers are probabilistic, which means a single check tells you almost nothing about where your brand actually stands. What you need is a repeatable scoring system that samples AI answers over time, across engines, against competitors. Here’s how to build one.
What an AI Visibility Score Actually Measures
An AI visibility score is a composite metric, typically normalized to a 0 to 100 scale, that quantifies how present and how well-positioned your brand is inside AI-generated answers. It’s not one number pulled from one platform. Professional measurement frameworks decompose it into seven dimensions, according to research compiled by Campaign Creators and HubSpot’s 2026 reporting frameworks for AI search:
| Dimension | Business question it answers |
|---|---|
| Visibility rate | Are we present when customers ask relevant questions? |
| Mention frequency | How often are we part of the conversational set? |
| Position | Are we a primary recommendation or a footnote? |
| Sentiment | Is the brand framed positively, neutrally, or negatively? |
| Citation share | How often do AI engines link back to our owned content? |
| Intent coverage | Are we visible for decision-stage queries, not just informational ones? |
| Citation value (CVR) | Is visibility translating into assisted conversions? |
Here’s the part that trips up most SEO teams: your Google rankings don’t predict this score. Recent academic work on ranking–mention separation found that traditional SEO metrics predict where a brand appears within an AI answer, but not whether it gets mentioned at all. AI models weigh entity authority, meaning structured data and third-party validation, more heavily than raw backlink counts.
So a domain authority of 70 and page-one rankings can coexist with a visibility score near zero. Different game, different scoreboard.
Why One-Time Checks Fail and Tracking Wins
Large language models are stochastic. The same prompt, asked twice in the same hour, can return different brand sets. That makes manual spot-checks statistically insignificant, no matter how carefully you phrase the query.
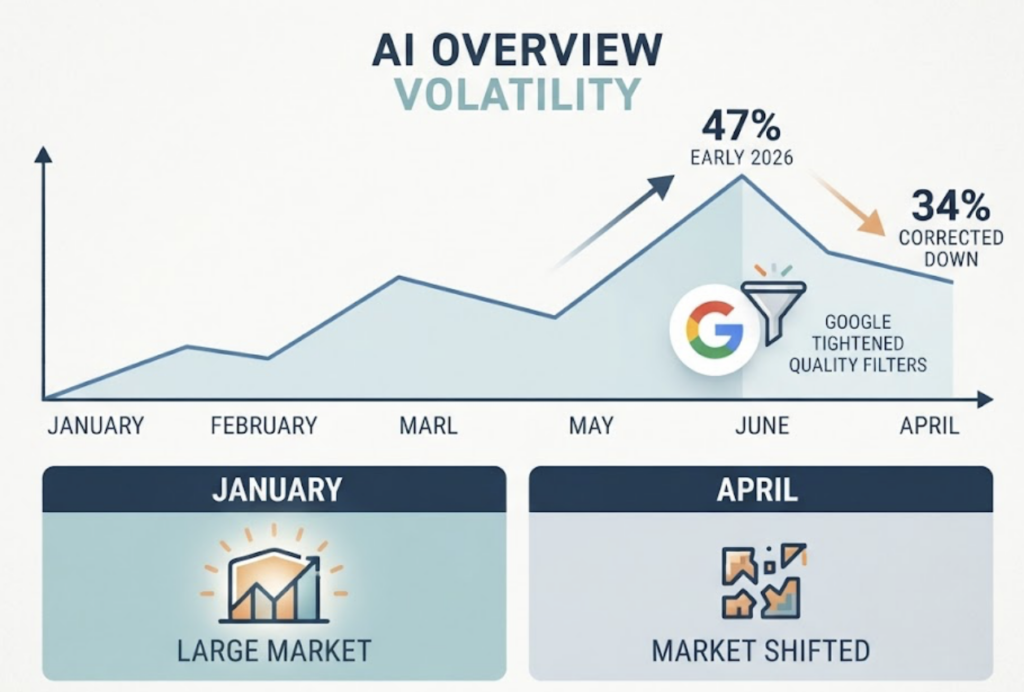
The environment itself is also unstable. Conductor’s 2026 industry volatility analysis found that AI Overview coverage across major industries peaked at 47% in early 2026, then corrected down to 34% as Google tightened quality filters. A brand that “checked its visibility” in January was measuring a market that no longer existed by April.
Tracking is a process, not an action.
There’s a practical upside to treating it that way. Longitudinal data turns your AI visibility score into a leading indicator: significant score drops often precede declines in branded search volume, which means a well-built tracking system flags brand health problems before they show up in your traffic reports. AI search traffic itself grew more than 500% year over year heading into 2026, so the cost of flying blind compounds every quarter.
How to Set Up AI Visibility Score Tracking Step by Step
The setup below moves you from screenshots to a system in four steps. Most teams can complete it in under two weeks.
Step 1: Define Your Prompt Universe
Start with 50 to 200 high-intent queries. Skip branded searches, since asking ChatGPT “what is [your brand]” tells you nothing about discovery. Focus instead on the queries buyers actually use before they know you exist: “best [product] for [industry],” “alternatives to [competitor],” “[category] comparison.”
Group prompts by intent stage. Comparison and alternative queries map to buyers closest to a decision, so weight them accordingly when you read the data later. Refresh the set quarterly, because buyer language shifts and last year’s phrasing stops matching how people actually ask.
Step 2: Choose Which AI Platforms to Sample
ChatGPT, Perplexity, and Google AI Overviews use different citation logic and different underlying sources. A brand can score 60 on Perplexity and 15 on ChatGPT for the identical prompt set. Sampling one engine gives you one engine’s opinion, not a market view.
Track at minimum the three platforms above, then extend based on where your audience lives. B2B software buyers lean on ChatGPT and Perplexity; consumer categories see more AI Overviews exposure. Teams operating in Asian markets should add DeepSeek, Doubao, or Qwen to the sampling rotation.
If you want to test the waters before committing to a full setup, this curated list of free GEO tools covers no-cost options for one-off visibility checks across major engines.
Step 3: Pick an AI Visibility Score Tool That Tracks Over Time
Free checkers answer “where am I today.” A dedicated AI visibility score tool answers “what changed, and why.” When evaluating any AI visibility score software or platform, four capabilities separate real tracking systems from repackaged rank trackers: multi-engine sampling, prompt-level history, sentiment measurement, and competitor benchmarking on identical prompt sets.
That last one matters more than teams expect. An absolute score of 65 is meaningless in isolation. If your closest competitor sits at 80, you have a problem; if the category leader sits at 40, you’re winning.
For teams that want the full seven-dimension scorecard in one place, Topify is built around exactly this model. Its GEO Analytics engine tracks visibility, sentiment, position, volume, mentions, intent, and CVR across ChatGPT, Gemini, Perplexity, DeepSeek, and other major engines, then benchmarks each dimension against competitors it auto-detects in your category. In practice, that means a visibility drop on Perplexity can be traced back to the specific source domain that stopped citing you, inside the same dashboard, without exporting anything to a spreadsheet. The Basic plan runs $99 per month and covers 100 tracked prompts with 9,000 AI answer analyses, which fits the 50 to 200 prompt universe most teams start with.
Other platforms in this space cover parts of the picture, and some do single-engine tracking well. The gap tends to show up in citation-layer analysis and cross-engine consistency, which is where composite scoring lives or dies.
Step 4: Set a Baseline and a Review Cadence
Run your full prompt universe across all tracked engines for 30 days before drawing any conclusions. That first month is your baseline, and everything after is trend data.
Then hold a rhythm: weekly reviews to catch sudden shifts from model updates or competitor content pushes, quarterly deep dives to reassess strategy and refresh the prompt set. Industry benchmarks give you rough context for the baseline itself. Scores below 8 signal pre-visibility, where the brand is essentially absent and needs entity-level foundations first. Scores from 8 to 25 indicate early traction with inconsistent appearances. Crossing 25 means regular presence in top-choice shortlists, the milestone that separates established category players from everyone else.
Reading the Dashboard: Signals Behind the Score
An AI visibility score dashboard earns its cost when it explains movement, not just displays it. Three reading patterns cover most situations.
When visibility drops, check citation share first. AI engines lean on a small set of third-party domains per category, and losing a citation from one high-weight source (a G2 category page, a Reddit thread, an industry roundup) can pull down mention frequency across every engine that draws on it.
When position slips but visibility holds, look at competitors. You’re still in the answer set, but someone displaced you from the primary recommendation slot, usually through fresher comparison content or new third-party validation.
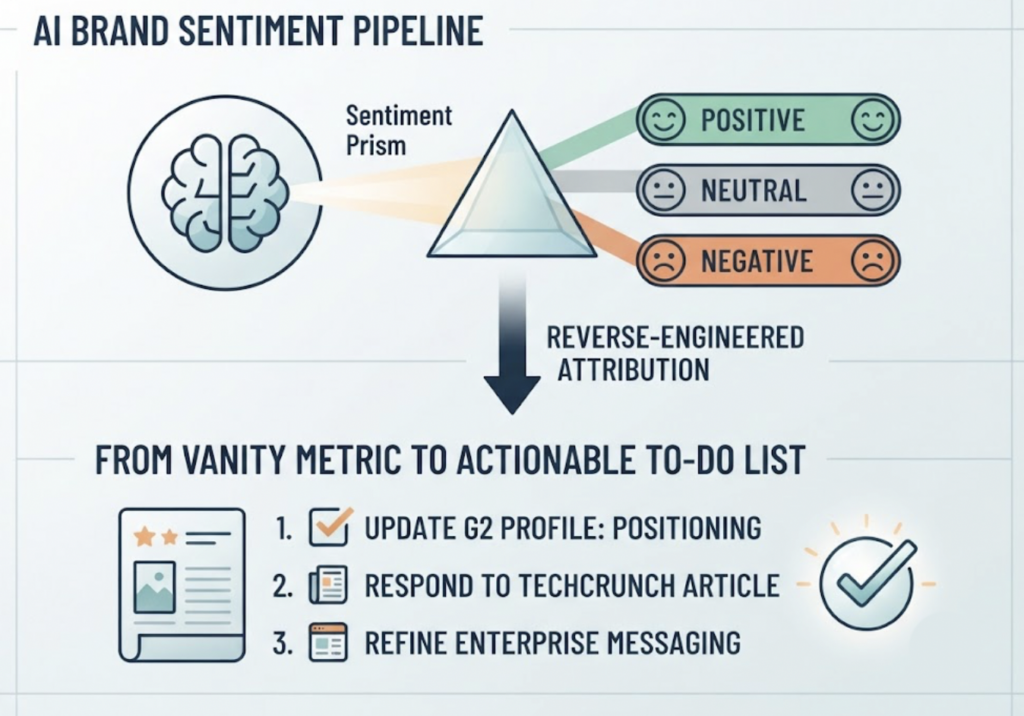
Sentiment deserves its own tracking lane. AI search analytics brand sentiment platforms measure a Net Sentiment Score, tracking whether AI describes your brand positively, neutrally, or negatively across responses. The risk isn’t just negative framing, it’s outdated framing: an engine calling your enterprise product “a budget option for small teams” is a positioning problem no traffic report will ever surface. Good sentiment tooling reverse-engineers the attribution, so a sentiment drop points you to the specific review site or article the AI is drawing that framing from. AgencyDashboard’s 2026 analysis of AI sentiment tracking found this source-level attribution is what turns sentiment data from a vanity metric into a fixable to-do list.
How to Improve a Low AI Visibility Score
The score is the output. These four inputs move it.
Close citation gaps. Identify which third-party domains AI engines favor for your category, then pursue placements there through digital PR, review campaigns, or community participation. If Reddit and G2 dominate citations in your space, a tenth blog post on your own domain won’t move the needle the way one strong G2 presence will.
Structure content for extraction. AI engines reward machine-readable answers. Clean organization and product schema, direct question-and-answer formatting, and comparison tables give models something to quote. Prose walls don’t.
Cover decision-stage intent. If your visibility concentrates on informational queries but disappears for “best X” and “alternatives to Y” prompts, your intent coverage dimension is dragging the composite score down. Build comparison and alternative content deliberately.
Feed results back into the system. Every content push should map to a hypothesis about a specific dimension: this G2 campaign should lift citation share, this comparison page should lift intent coverage. Then watch the weekly data to confirm or kill the hypothesis. Without that loop, you’re publishing on faith.
Conclusion
The screenshot-in-Slack era of AI visibility ends the moment someone asks “compared to what?” A score without a baseline, a trend line, and a competitive reference point is trivia. With those three things, it becomes the earliest warning system your brand has, surfacing shifts weeks before they reach your traffic dashboards.
Start small: define 50 prompts, pick three engines, and run a free scan to establish where you stand today. From there, set up automated tracking and let the 30-day baseline accumulate while you work on citation gaps. The teams winning AI search in 2026 aren’t the ones checking most often. They’re the ones measuring consistently.
FAQ
Q: What is a good AI visibility score?
A: Context matters more than the absolute number, but industry benchmarks offer rough stages: below 8 means the brand is effectively invisible, 8 to 25 indicates early and inconsistent traction, and above 25 signals regular presence in top-choice shortlists. The more useful question is how your score compares to direct competitors on identical prompts.
Q: How often should you review AI visibility score tracking data?
A: Weekly for tactical shifts, quarterly for strategy. AI answers move fast enough (model updates, citation source changes, competitor pushes) that monthly-only reviews miss the cause of most score movements.
Q: What’s the difference between an AI visibility score tool and a traditional rank tracker?
A: Rank trackers measure a deterministic position for a URL on a results page. An AI visibility score system samples probabilistic answers repeatedly, across multiple engines, and scores brand presence rather than URL position. Research on ranking–mention separation shows the two measure genuinely different things: strong rankings don’t guarantee AI mentions.
Q: Do AI search analytics brand sentiment platforms measure the same thing as visibility scores?
A: They measure one dimension of it. Sentiment tracks how AI frames your brand when it appears; the visibility score also covers whether, how often, and in what position you appear. Sentiment without visibility data misses absence, and visibility without sentiment misses framing problems. Composite platforms track both.