
You’re pulling screenshots from ChatGPT, copying Perplexity answers into a spreadsheet, and manually checking whether Gemini mentions your brand this week. That’s not analytics. That’s a scavenger hunt. And it’s costing your team hours every reporting cycle while the data goes stale before it reaches a slide deck.
The gap isn’t awareness. Most marketing teams already know AI search matters. The gap is measurement infrastructure: a single view that turns scattered AI responses into structured, trackable data. That’s what an AI visibility analytics dashboard is built to solve.
What an AI Visibility Analytics Dashboard Actually Tracks
An AI visibility analytics dashboard is a centralized interface that monitors how AI platforms mention, describe, and rank your brand in their generated responses. It’s not a traditional SEO dashboard with a new label.
Traditional SEO dashboards track keyword positions on Google, organic traffic, and backlink profiles. An AI visibility analytics dashboard tracks something fundamentally different: how language models synthesize information about your brand across ChatGPT, Perplexity, Gemini, AI Overviews, and DeepSeek.
The distinction matters because AI search behavior doesn’t follow the same rules. Zero-click interactions now account for 60 to 93% of activity on major AI platforms. Users don’t scroll through ten blue links. They read one synthesized answer and move on. If your brand isn’t in that answer, you’re invisible.
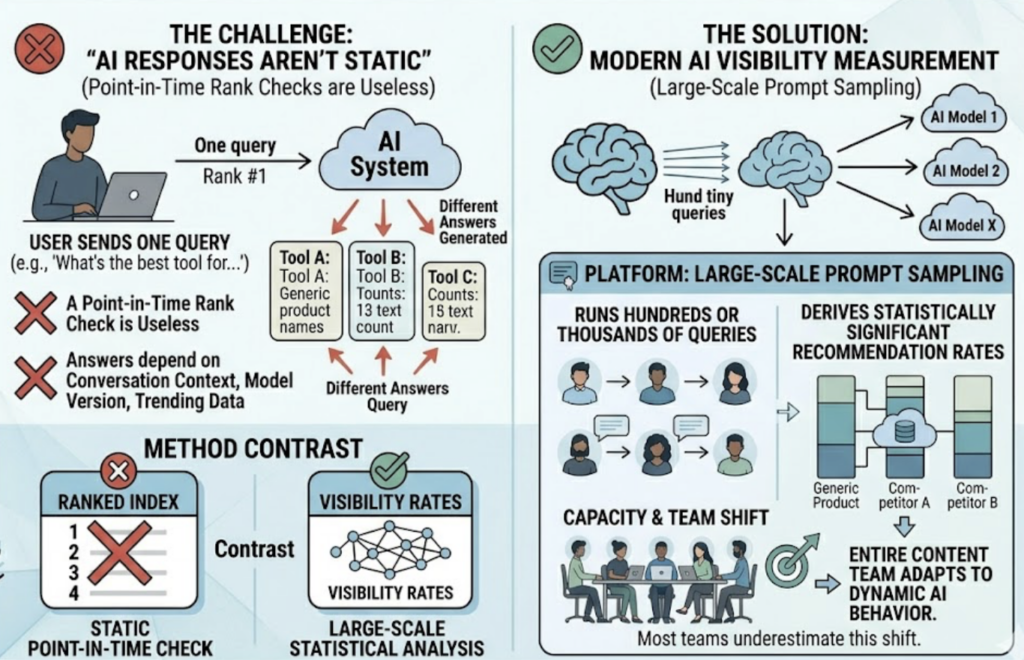
Here’s the other shift most teams underestimate: AI responses aren’t static. The same prompt can produce different answers depending on conversation context, model version, and trending data. That makes point-in-time rank checks almost useless. Modern AI visibility measurement relies on large-scale prompt sampling, running hundreds or thousands of queries to derive statistically significant recommendation rates.
That’s why traditional SEO tools can’t simply add an “AI tab” and call it done. The entire measurement model is different.
The 7 Metrics Every AI Visibility Analytics Dashboard Needs
To answer the three questions every executive eventually asks, “Do we have a problem? How big is it? Are we making progress?”, your dashboard needs to track seven core metrics.
| Metric | What It Measures | Why It Matters |
|---|---|---|
| Visibility Score | % of relevant queries where your brand appears | Baseline for brand recognition in AI answers |
| Sentiment Score | Polarity of how AI describes your brand (positive/neutral/negative) | Detects framing issues: “budget” vs. “premium” |
| Position Rank | Where your brand appears in the answer sequence | First mention typically captures the most engagement |
| AI Search Volume | Estimated query volume for AI-intent keywords | Quantifies market size of AI-native discovery |
| Mention Count | Total frequency of brand appearances | Raw volume baseline across platforms |
| Intent Match | How well AI’s description aligns with the user’s prompt | Measures “content-product fit” for AI synthesis |
| CVR | Downstream conversion impact from AI referrals | Links visibility to revenue |
Position Rank deserves extra attention if you’re tracking AI Overviews specifically. Among top AI overviews rank trackers, the ability to monitor where your brand lands in Google’s AI-generated snippets, not just ChatGPT or Perplexity, is what separates actionable data from vanity metrics.
Most dashboards show you three or four of these. The ones that cover all seven give you something rare: a full picture of how AI sees your brand, not just whether it mentions you.
5 Mistakes That Make AI Visibility Dashboards Useless
Tracking AI visibility without the right structure creates a false sense of control. Here are the patterns that quietly undermine most setups.
Tracking only one platform. ChatGPT gets the attention, but Perplexity serves research-heavy queries, Gemini handles Android-native search, and AI Overviews intercepts transactional intent on Google. A dashboard locked to one platform misses how different AI engines recommend differently.
Counting mentions without sentiment. Your brand might appear in 40% of relevant queries. That sounds great until you discover the AI consistently frames you as “complex to set up” or “better suited for small teams.” Mention count without sentiment analysis is half the story.
No competitor benchmarks. A 35% visibility score means nothing without context. Is that good? Bad? Declining? Without competitor data layered alongside your own, dashboards produce numbers that can’t inform strategy.
Monthly manual checks instead of automated monitoring. AI answers shift with every model update and data refresh. Checking once a month misses the dynamic drift that can quietly erode your position over weeks.
Ignoring content structure. Sites that aren’t built for machine readability, missing schema markup, poor heading hierarchy, or answers buried deep in long pages, get consistently overlooked by AI models regardless of their domain authority.
How to Build an AI Visibility Analytics Dashboard That Works
Setting up a dashboard that produces actionable data, not just charts, follows a four-step process.
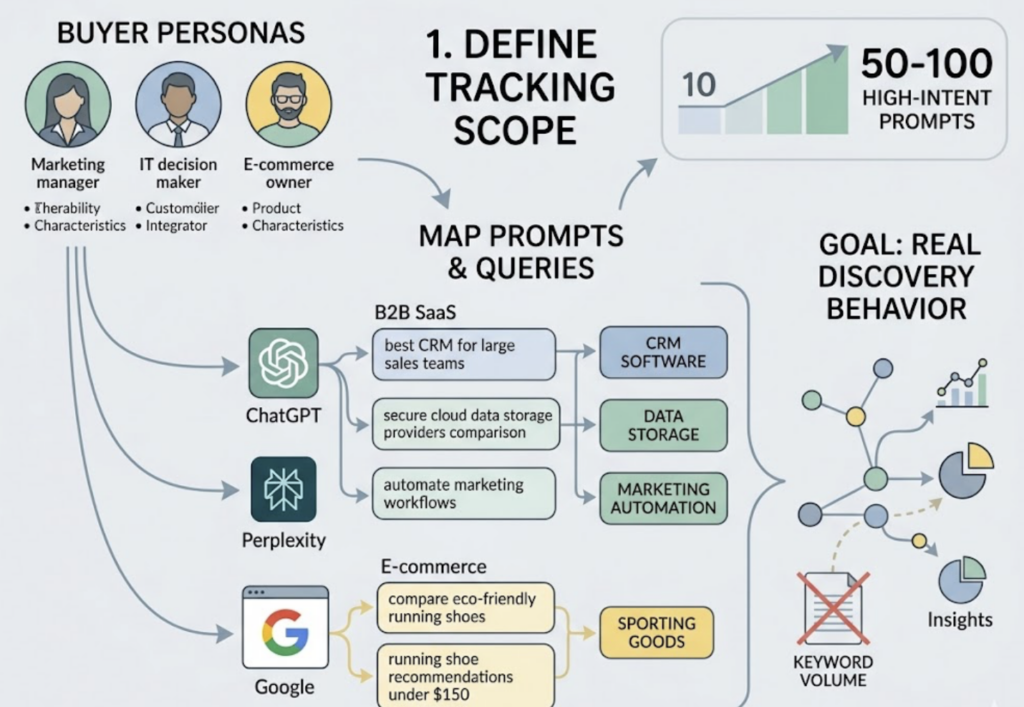
Step 1: Define your tracking scope. Start with your buyer personas and map the prompts they’d realistically type into ChatGPT, Perplexity, or Google. A B2B SaaS brand might track 50 to 100 high-intent prompts across product categories. An ecommerce brand might focus on comparison and recommendation queries. The goal is coverage that mirrors real discovery behavior, not keyword volume.
Step 2: Choose a platform that covers multiple AI engines. This is where most teams hit a wall. You need a tool that automates structured probing, running thousands of daily queries across multiple LLMs to simulate real user discovery. Topify covers ChatGPT, Gemini, Perplexity, DeepSeek, and several other major AI platforms from a single dashboard. It tracks all seven metrics listed above: visibility, sentiment, position, volume, mentions, intent, and CVR. For teams evaluating top AI overviews rank trackers specifically, Topify includes AI Overviews tracking alongside LLM-native platforms.
In practice, this means you can spot a drop in ChatGPT mentions and trace it back to a specific source that stopped citing your brand, all within the same interface. The platform also auto-detects competitors and benchmarks their visibility against yours, which solves the “numbers without context” problem.
Step 3: Build competitor benchmarks from day one. Don’t wait until month three to add competitors. Layer their data from the start so every metric has a reference point. Topify’s Competitor Monitoring automatically identifies relevant competitors in your category and tracks their visibility, sentiment, and position alongside yours.
Step 4: Set a monitoring cadence. Daily automated scans for high-priority prompts. Weekly reviews for trend shifts. Monthly deep-dive audits for strategic adjustments. AI visibility is not a set-and-forget dashboard. It requires governance.
What the Market Data Says About AI Visibility Analytics Dashboards
AI search traffic has grown 527% year-over-year as of 2026. That’s not a trend on the horizon. It’s already the primary discovery channel for a growing share of users.
The downstream impact is measurable. Gartner projects that 30% of digital marketing budgets will shift toward AI-focused optimization by 2027. At the same time, informational query traffic for non-branded sites is projected to decline by 35% over the same period.
The brands investing in AI visibility analytics dashboards now aren’t doing it because it’s novel. They’re doing it because the data shows that traditional search traffic is contracting while AI-driven discovery is expanding. An AI visibility analytics dashboard isn’t an add-on to your existing analytics stack. It’s becoming the primary lens for understanding how your audience finds you.
For teams ready to start, Topify offers plans starting at $99/month for 100 tracked prompts across ChatGPT, Perplexity, and AI Overviews, scaling to $199/month for 250 prompts and broader team access. Enterprise plans with dedicated account management start at $499/month.
Conclusion
The shift from tracking clicks to tracking AI citations isn’t theoretical. It’s already reshaping how marketing teams measure brand performance. The teams still cobbling together manual checks and single-platform snapshots are working with incomplete data, and they know it.
An AI visibility analytics dashboard built around the right metrics, covering the right platforms, with competitor benchmarks baked in, turns that fragmented picture into a clear signal. Start with the seven metrics. Choose a tool that automates multi-platform tracking. And treat AI visibility as a daily discipline, not a quarterly curiosity.
FAQ
Q: What is an AI visibility analytics dashboard? A: It’s a centralized platform that tracks how AI search engines like ChatGPT, Perplexity, and Google AI Overviews mention, describe, and rank your brand in generated responses. Unlike traditional SEO dashboards, it measures AI-specific metrics like visibility score, sentiment, position rank, and citation sources.
Q: How does an AI visibility analytics dashboard work? A: It works by running large-scale automated queries (structured probing) across multiple AI platforms, then analyzing the responses for brand mentions, sentiment, positioning, and source citations. The data is aggregated into a single view with trend tracking and competitor benchmarks.
Q: How much does an AI visibility analytics dashboard cost? A: Pricing varies by platform and scope. Topify’s plans start at $99/month for basic tracking across three AI platforms with 100 prompts, and scale to $199/month (Pro) and $499+/month (Enterprise) for higher prompt volumes, more projects, and dedicated support.
Q: What are examples of AI visibility analytics dashboard metrics? A: The core seven include Visibility Score (% of queries where you appear), Sentiment Score (how AI frames your brand), Position Rank (where you land in the answer), AI Search Volume, Mention Count, Intent Match, and CVR (conversion impact from AI referrals).