A practical framework for measuring brand visibility across ChatGPT, Gemini, and Perplexity
You run the weekly report. Rankings are stable. Organic traffic is up. The dashboard looks fine.
Then a colleague casually mentions they found your main competitor recommended three times while researching options in ChatGPT. Your brand didn’t appear once. You have no metric to explain why, no way to know how long it’s been happening, and no clear path to fixing it.
That’s the measurement gap most marketing teams haven’t closed yet.
Traditional SEO metrics were built for a list-based world. KPIs for AEO — answer engine optimization — require an entirely different framework. When AI delivers one synthesized answer instead of ten blue links, “position 1” is no longer the goal. What matters is whether you’re in the answer at all, what the AI says about you, and whether your competitors are being named first.
Your Old SEO Dashboard Is Measuring the Wrong Race
The metrics you’ve relied on for years — keyword rankings, organic clicks, impressions — weren’t designed to capture what happens inside a generative response.
Here’s the structural problem. AI Overviews and conversational interfaces act as a proxy for the user, synthesizing multiple sources and delivering a single answer. That process reduces the click-through rate for the top organic result by an average of 58% to 61%. That traffic doesn’t go to competitors in the traditional sense. It stays inside the AI interface.
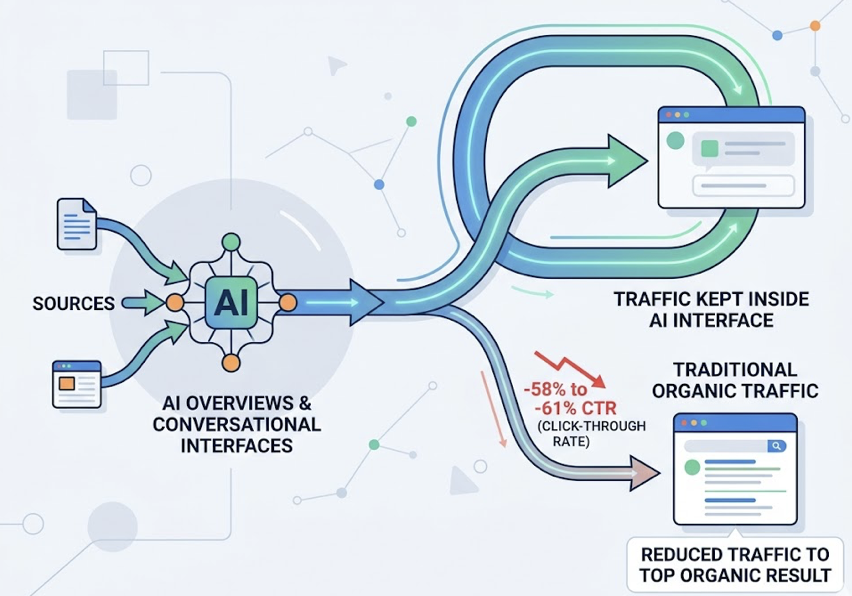
What’s more, standard analytics platforms like GA4 typically misclassify AI-driven brand exposure as “Direct” or “(not set)” traffic because AI assistants frequently strip referral headers and UTM parameters. You’re likely receiving more AI-driven interest than your current reports show.
The deeper shift is about authority, not traffic. In traditional SEO, visibility was a function of position. In the generative era, it’s a function of “Information Gain” — whether your content provides unique, factual, structured data that AI finds indispensable for its response. That’s a different race. And it requires different metrics to run it.
The 6 AEO KPIs That Actually Tell You Where You Stand
AI Visibility Rate
This is the foundational metric of AEO, and the closest successor to keyword rankings.
AI Visibility Rate measures the percentage of queries within your tracked prompt set where your brand is mentioned, cited, or recommended by the AI. The formula: queries with brand mention divided by total tracked queries, multiplied by 100.
What makes this metric meaningful is its scope. A brand may have strong visibility on branded queries but zero visibility on high-intent category comparisons — the exact queries where purchase decisions happen. Professional tracking typically starts with a “Master Prompt List” of 50 to 1,000 queries that reflect how real users search for solutions in your category.
Visibility tiers help you read your position quickly: 0–10% means you’re largely absent from AI knowledge models; 10–20% signals occasional mentions with low authority; 20–40% puts you in the competitive range alongside recognized peers; above 40% signals category dominance.
AI Sentiment Score
Showing up in an AI response isn’t enough. How you show up matters just as much.
AI Sentiment Score tracks the qualitative framing AI engines use when they describe your brand. LLMs don’t just list options — they characterize them. Describing your product as “feature-rich but expensive” or “great for beginners but lacks enterprise scaling” shapes user perception before a single click occurs.
The Net Sentiment Score (NSS) categorizes mentions into five tiers: Endorsement (AI proactively recommends your brand as the primary solution), Neutral Mention (factual, no evaluative language), Cautious Mention (includes hedging or caveats), Negative Mention (highlights weaknesses or criticism), and Hallucination (AI generates incorrect information). Scores above +60 signal a defensible brand position in AI search. Scores below -20 indicate your digital footprint is actively working against your sales pipeline.
That last scenario — negative AI sentiment — is particularly damaging because most brands don’t catch it until the pipeline impact is already visible.
Share of Voice vs. Competitors
In most generative responses, AI surfaces several vendors or solutions at once. AI Share of Voice tells you who’s dominating that recommendation window.
The formula: your brand mentions divided by total tracked brand mentions across your competitive set, multiplied by 100. It’s a leading indicator of future market share. When AI satisfies up to 93% of informational search intent without a click, the brand appearing most consistently as the “consensus pick” across ChatGPT, Gemini, and Perplexity captures the cognitive awareness that drives branded searches and offline conversions later in the funnel.
Position in AI Answers
Not all mentions carry equal weight. The order matters.
Being the first brand named in a generative response carries significantly more authority than appearing fourth in a trailing list. The Citation Placement Index (CPI) assigns weighted values based on position: a primary recommendation earns 10 points; top-3 placement earns 7; a lower list placement earns 4; a trailing or passing mention earns 2.
Brands with higher CPI scores tend to benefit from what researchers call “Reinforced Visibility.” As AI generates follow-up responses within a conversation thread, it’s more likely to stay anchored to the entity it introduced first. First mention isn’t just an impression — it compounds.
Source Citation Rate
This KPI tends to surprise marketing teams the most.
Roughly 85% of citations in AI responses come from third-party sources — Reddit, Wikipedia, G2, industry publications — rather than brand-owned domains. So Source Citation Rate doesn’t just track whether AI links to your website. It tracks which domains are actually shaping the AI’s narrative about your category.
The citation landscape differs sharply by platform. ChatGPT leans on Wikipedia (47.9%) and news sources; Perplexity favors Reddit (46.7%) and industry blogs; Google AI Overviews draw from YouTube (23.3%) and Reddit (21%). If your brand isn’t present in these high-trust third-party ecosystems, you’re leaving the narrative to others — or to your competitors.
Conversion Visibility Rate (CVR)
This is where AEO connects directly to revenue.
AI-referred visitors are among the most qualified traffic sources you can get. Users arriving from ChatGPT convert at approximately 15.9%, compared to 1.76% for traditional organic search. Perplexity referrals convert at around 10.5%. The reason is structural: by the time someone clicks through from an AI answer, the AI has already handled the research and comparison phase of the buyer journey. They arrive ready to engage.
CVR estimates the revenue value of your AI visibility by applying that conversion premium to your tracked mention volume. It’s the metric that turns an AEO report from an awareness slide into a business case leadership actually cares about.
One Number That Ties All Six Together
Six metrics can complicate a stakeholder presentation. The Visibility Coefficient (Cv) simplifies it.
It’s a composite index that normalizes mention frequency, sentiment, and position into a single score from 0 to 100. The formula: average brand mention frequency multiplied by a sentiment weight, divided by total category queries.
Think of it as a leading indicator of brand equity in the machine-learning era. A high score means AI models — trained on billions of data points — consistently treat your brand as the category default. That reduces dependence on expensive paid terms. A declining score is an early warning system: sentiment drift, content gaps, or a competitor quietly gaining ground in the AI’s retrieval index.
It’s also what you bring to a quarterly review when you need to show AEO momentum without a 20-slide breakdown.
Most Teams Start Tracking After the First Traffic Drop. Here’s the Baseline You Need
Waiting for a traffic anomaly before establishing AEO baselines is one of the most common mistakes marketing teams make. Without a “before” snapshot, there’s no way to validate whether your AEO efforts are working.
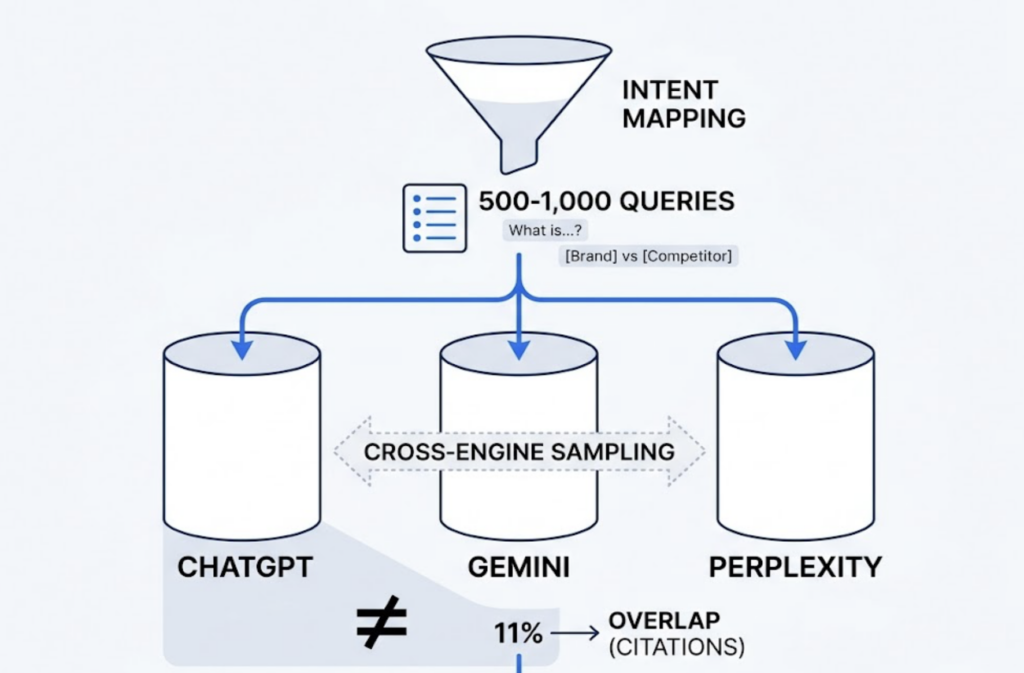
A solid baseline starts with intent mapping: build a list of 500 to 1,000 queries spanning the full customer journey, from “what is [category]” through “[your brand] vs [competitor].” Then run those queries across ChatGPT, Gemini, and Perplexity. Cross-engine sampling is essential — a brand may have strong Perplexity visibility (which searches the live web) while being largely invisible on ChatGPT (which relies more on training data and the Bing index). Only about 11% of domains are cited by both platforms, which means the two ecosystems require separate strategies.
Record brand position and sentiment for each response. Map which third-party domains the AI is citing when discussing your category. Run the same prompts for 3–5 competitors. That’s your Narrative Baseline. Every subsequent measurement gets compared to it.
Context matters for target-setting. AI Overview triggers vary significantly by industry: Healthcare sees a 48.7% trigger rate, making high visibility close to table stakes. SaaS and B2B sit around 30%, where a >25% visibility target is a reasonable first benchmark. Real Estate triggers at just 4.4%, so a 10% visibility rate may actually signal leadership in that segment.
When Your Numbers Look Bad: What to Do First
Low visibility and poor sentiment have different root causes. They need different fixes.
If your AI Visibility Rate is low, the most common cause is content structure. AI engines using Retrieval-Augmented Generation (RAG) prioritize content that can be extracted cleanly — direct, factual, structured summaries. Content with consistent H1-H2-H3 heading hierarchies is 40% more likely to be cited by LLMs. Adding 40–60 word “atomic answers” at the top of high-traffic pages significantly improves extractability. Embedding YouTube content on key topic pages also matters: YouTube signals correlate with AI citation at 0.735, the highest correlation of any measured signal.
If visibility is adequate but sentiment is negative, the fix is third-party reputation work. AI uses multi-source corroboration to determine what it believes about a brand. A negative Reddit thread from 2022 or an outdated industry article can drive poor sentiment consistently across platforms. Actively seeking mentions in high-authority “trust neighborhoods” — Wikipedia, industry publications, review platforms like G2 — delivers more impact on sentiment than any on-page optimization.
Data freshness also has a measurable effect. Refreshing content timestamps and updating product information can shift AI ranking positions by up to 95 places.
How Topify Turns These 6 KPIs Into a Live Dashboard
Manual tracking across ChatGPT, Gemini, and Perplexity is workable for an initial audit with a small prompt set. It doesn’t scale.
For marketing teams managing AEO visibility across dozens of prompts, multiple platforms, and a shifting competitive set, Topify centralizes all six metrics into a single operating view. In practice, this means you can open a weekly report, see that your ChatGPT Visibility Rate dropped 14 points over the past month, trace it to a third-party source that stopped citing your brand, and identify which competitor captured that share — all within the same dashboard.
The platform covers the full KPI stack: real-time AI Visibility Tracking across ChatGPT, Gemini, Perplexity, and other major engines; Sentiment Analysis with 0–100 scoring; Position Tracking and competitor Share of Voice monitoring; Source Analysis that reverse-engineers exactly which domains AI platforms are citing in your category; and CVR estimation to connect visibility data to revenue impact.
Topify also flags hallucinations — cases where AI generates inaccurate information about your brand — before they compound into sustained negative sentiment. And it continuously surfaces high-value prompts your brand isn’t appearing for yet, so you’re optimizing toward opportunity, not just defending what you already have.
For teams that want to move from insight to action, Topify’s One-Click Agent Execution identifies citation gaps and deploys optimized content directly, without manual workflows.
Conclusion
The shift from SEO to AEO isn’t incremental. It’s structural — a move from measuring clicks to measuring authority inside the AI’s answer.
Your existing analytics stack isn’t broken. It’s just measuring the wrong thing. The six KPIs for AEO — Visibility Rate, Sentiment Score, Share of Voice, Position, Source Citation Rate, and CVR — give you a framework to understand where your brand actually stands when a potential customer asks an AI for a recommendation. Start with a 30-day baseline. Pick two or three metrics to track weekly. And don’t wait for a traffic anomaly to discover you’ve been invisible.
FAQ
Q: What’s the difference between AEO KPIs and GEO KPIs?
A: AEO (Answer Engine Optimization) and GEO (Generative Engine Optimization) are often used interchangeably, and their core KPIs overlap significantly. In practice, GEO refers to the broader strategy of optimizing for generative AI platforms, while AEO emphasizes the answer layer specifically — how your brand appears within AI-synthesized responses. The six KPIs in this framework apply equally to both.
Q: How often should I review these metrics?
A: For real-time retrieval platforms like Perplexity, a weekly cadence is recommended for high-growth teams. Monthly trend analysis is the standard for board-level reporting on Share of Voice progress. At minimum, run a full cross-engine audit quarterly to catch shifts in citation sources and competitor positioning.
Q: Can I track AEO KPIs without a paid tool?
A: A manual baseline with 50–100 prompts is feasible, and it’s worth doing early. The practical limit is consistency. AI responses aren’t static — running the same prompt on the same platform on different days can produce different answers. At scale, that variability makes manual tracking unreliable. Dedicated platforms address this through browser-level crawling and statistical sampling across large prompt sets.
Q: How do I explain AEO KPIs to leadership?
A: Lead with CVR and the Visibility Coefficient. CVR connects AI visibility directly to conversion value, which makes the business case immediately legible. The Visibility Coefficient gives leadership a single trend number to track over time — similar to how NPS works for customer experience reporting. Avoid leading with raw Visibility Rate alone; without competitive context, a 22% rate has no obvious meaning.

