
Your top keywords held position. Your domain authority didn’t move. Then the quarterly report came back with informational pages down double digits, and no core update to point at. The gap isn’t in your rankings. It’s in the layer above them, where an answer gets written before anyone scrolls to a blue link. AI search volume didn’t just grow over the past 12 months. It reallocated, fast enough that a year-old measurement setup is now reporting on a search experience that no longer exists.
Your Rankings Held. The Clicks Didn’t.
Start with what collapsed, because it’s the part most dashboards still can’t show you.
The share of Google searches producing at least one click fell 9.51 percentage points between 2024 and 2026, a relative decline of 22.9%, according to SparkToro data. That figure includes paid clicks and clicks to Google-owned properties, so the drop reaching independent sites is steeper than the headline suggests.
Position one absorbed most of the damage. When an AI Overview appears, the top organic result’s CTR falls from 31.7% to 19.8%, a 37.5% relative decline, while positions two through five lose about 12%. Ranking first stopped meaning what it meant two years ago.
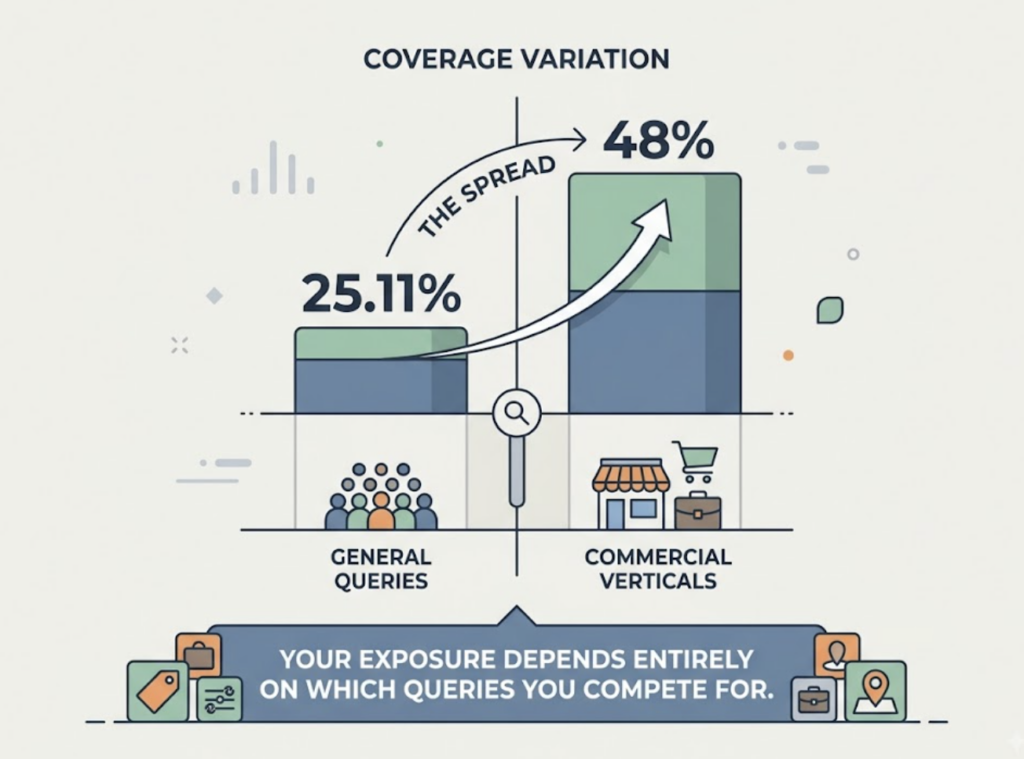
Coverage kept expanding through the year. Conductor’s Q1 2026 benchmark across 21.9 million queries put AI Overview prevalence at 25.11%, while trackers focused on commercial verticals recorded roughly 48% by March 2026. The spread between those two numbers is itself useful: your exposure depends almost entirely on which queries you compete for.
Behavioral data confirms the pattern rather than modeling it. Pew Research tracked real browsing sessions and found users clicked a traditional result 8% of the time when an AI Overview was present, against 15% when it wasn’t.
That’s the collapse. Now the harder question: where did the demand go?
What Grew in AI Search Volume Was Citation Frequency, Not Traffic
The instinct is to measure AI search volume the way we measured Google, by counting sessions. That undercounts the shift by an order of magnitude, because most AI answers never produce a session at all.
The number that actually moved is how often AI systems cite anything. Citation presence in US ChatGPT prompts rose from about 1.6% in June 2025 to roughly 6.8% by May 2026, and the rate splits hard by vertical: around 23% in Travel and Hospitality, around 20% in Automotive, under 4% in Professional Services. If you sell professional services, a citation-only strategy is competing for a very thin slice. If you sell travel, the slice quadrupled while most teams weren’t watching.
Referral volume grew too, from a small base. One panel of 166 GA4 properties measured 6.77 million LLM-driven sessions and 12.8x growth over 19 months, from 47,606 sessions in November 2024 to 610,910 by May 2026.
Here’s the part that changes how you value it. LLM-referred visitors convert at roughly 4.4x the rate of organic search visitors, because they arrive with intent already validated by the AI’s recommendation. A channel at 2% of your traffic doing 4x the conversion rate isn’t a rounding error in your reporting. It’s a line item you don’t have.
Three Reports, Three Different Numbers for the Same Year
This is where a lot of GEO strategy quietly goes wrong.
Ask three credible sources what happened to ChatGPT’s share of AI referrals over the last 12 months and you get three incompatible answers. Similarweb’s traffic data shows ChatGPT sliding from roughly 76% of worldwide generative AI web traffic a year ago to around 53%, with Gemini past a quarter and Claude the fastest-growing platform in the category. The GA4 panel above reports 92.4% of AI referral traffic still coming from ChatGPT. A third study of B2B brand sites landed near 62.6%.
None of them is wrong. They’re measuring different things: total platform web traffic, referral clicks landing on a specific panel of sites, and B2B-weighted brand referrals. Panel composition decides the answer.
The takeaway isn’t that the industry data is unreliable. It’s that industry averages can’t tell you your number.
Your category’s platform mix, citation rate, and answer position are properties of your queries, not of the market. That’s the gap a GEO rank tracker fills, and it’s why the tooling question stopped being optional sometime around the middle of last year.
Why AI Search Volume Doesn’t Show Up in a Keyword Rank Tracker
Two structural differences make the old instrument unusable here.
The first is instability. A citation isn’t a ranking that decays over months. SISTRIX’s April 2026 citation drift study across six countries found 54 to 59% of cited domains shift week over week, with ChatGPT replacing roughly 74% of its cited domains each week. Monthly snapshots of something that turns over weekly produce noise, not trend lines.
The second is that the query you optimize for isn’t the query the engine runs. ChatGPT produced 91% unique queries with only 13% word overlap with what the user typed, while Perplexity stayed close to the original phrasing at 88% overlap. Your keyword list and the engine’s internal fan-out are two different vocabularies, which is why keyword volume alone can’t stand in for AI search volume.
| Dimension | Keyword rank tracker | GEO rank tracker |
|---|---|---|
| Unit of measurement | Position on a results page | Frequency of appearance inside an answer |
| Query input | Fixed keyword list | Prompt sets, expanded to match engine fan-out |
| Update cadence that makes sense | Weekly to monthly | Daily to weekly, given citation drift |
| Competitive read | Who outranks you on one page | Who gets named alongside you, and in what order |
| Failure mode it catches | Ranking drop | Silent removal from the answer with rankings intact |
That last row is the one worth sitting with. A brand can hold every ranking it had in 2025 and be absent from every AI answer in its category, and no traditional report will flag it.
The Query Types Gaining Volume and the Ones Being Absorbed
Aggregate volume hides the actual reallocation. Break it down by intent and the picture gets far more actionable.
AI Overviews started as an informational feature and didn’t stay one. In January 2025, 91.3% of queries triggering an AI Overview were informational. By October 2025 that share had dropped to 57.1%, while navigational triggers went from 0.74% to 10.33%. Commercial intent moved into the overview layer during the same window.
Comparison queries are now almost fully absorbed. Seer Interactive’s analysis of 49,353 queries found X vs Y comparison formats trigger AI Overviews 95.4% of the time, question formats 85.9%, and review queries 86.3%. If your content strategy leans on comparison and review pages, that traffic is being answered upstream of your page.
The AI-native platforms tilt the other way. Informational and research queries make up about 58% of ChatGPT Search volume, while purely transactional queries account for roughly 3%. Publishers and top-of-funnel content took the hit first. Ecommerce and transactional pages have been slower to feel it.
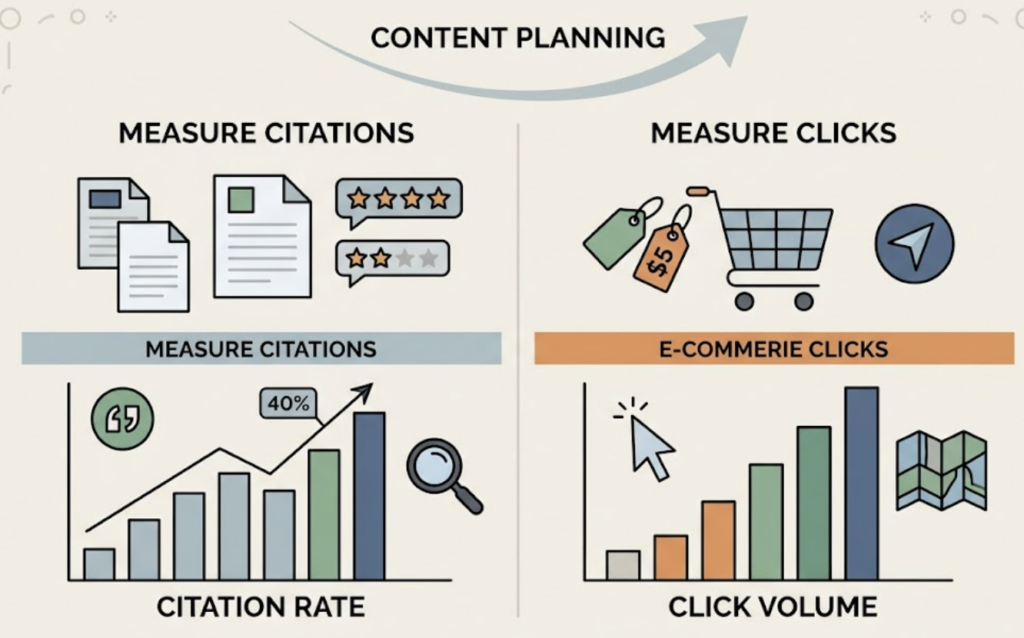
Read those three datasets together and the planning implication is clear. Comparison, review, and definitional content should be measured on citation rate, not click volume. Transactional and navigational pages should still be measured on clicks, for now.
Being cited still pays, even on the click side. Per million impressions on informational queries, cited brands take roughly 20,743 clicks against 9,445 for uncited brands on the same AI Overview query. Citation is worth more than double the residual traffic of non-citation.
What Belongs on Your GEO Rank Tracker for the Next 12 Months
Given the drift rates and the intent reshuffling above, four things need continuous measurement rather than quarterly audits.
Cross-platform visibility, weighted to your audience. Platform share disagreements in the public data mean you need your own read on which engines actually send and influence your buyers.
Prompt-level volume, not keyword volume. Prompt demand and keyword demand are related but not interchangeable, and brand-direct prompts behave differently from open-ended ones: they trigger a site-specific query against the named brand’s domain 40% of the time versus 16% for open-ended prompts. Those are two separate markets inside one category.
Position relative to competitors, not just presence. Being named third in a five-brand answer is a different outcome from being named first, and presence-only tracking flattens that distinction.
The source domains behind each answer. With most cited domains rotating weekly, knowing which third-party pages carry your mentions is what makes a visibility drop diagnosable instead of mysterious.
Topify is built around that combination. It monitors brand performance across ChatGPT, Gemini, Perplexity, and other major engines on seven metrics: visibility, sentiment, position, volume, mentions, intent, and CVR. In practice, that means a drop in ChatGPT mentions can be traced back to a specific source domain that stopped citing you, inside the same view where you spotted the drop. High-value prompt discovery keeps surfacing new prompts as recommendation patterns shift, and competitor benchmarking shows who the engines are naming instead of you. Plans start at $99 per month for 100 tracked prompts, which is roughly the size of a first serious prompt set for a single category.
Whatever tool you use, the cadence matters more than the vendor. Weekly, at minimum, on a fixed prompt set.
Conclusion
The last 12 months didn’t reduce search demand. They relocated it, from a ranked list you could measure with one tool into a synthesized answer that changes composition every week. Clicks fell hardest on the query types that used to feed top-of-funnel content. AI search volume grew fastest in categories most brands weren’t tracking at all.
Start with your 30 highest-intent prompts, not your keyword list. Measure how often you appear, in what position, and which domains carry the mention. Run it weekly for a quarter. That baseline is worth more than any industry benchmark, because it’s the only number that describes your brand. You can get started with Topify on a single project to see where the gaps sit before committing to a full prompt set.
FAQ
Q: What is AI search volume, and how is it different from keyword volume?
A: Keyword volume counts how many times a phrase is typed into a search engine. AI search volume describes how much demand flows through prompts on platforms like ChatGPT, Gemini, and Perplexity. The two overlap but don’t map cleanly, since a single keyword can fan out into hundreds of distinct prompts phrased in natural language.
Q: How do I get AI search volume or prompt volume data?
A: There’s no public equivalent of Keyword Planner for AI prompts. Most teams use two proxies: existing keyword volume as a demand signal, and prompt-level tracking of a fixed prompt set to measure how often the brand surfaces. Segment brand-direct prompts from open-ended ones, since they behave differently.
Q: How is a GEO rank tracker different from a traditional rank tracker?
A: A keyword rank tracker answers “where does this page sit on a results page.” A GEO rank tracker answers “does the answer mention us at all, and why.” The difference matters because rankings can stay flat while AI mentions disappear, and no SERP-based report will surface that.
Q: How often should I track AI citations?
A: Weekly at minimum. With more than half of cited domains rotating week over week on major platforms, monthly checks smooth over the exact movements you’d want to act on.