
You pull up three GEO tools, type in the same topic, and get three different monthly volume numbers. Not close either, sometimes a 3x spread on the exact same query set. The instinct is to assume one tool got it right and the other two got it wrong.
That’s not what’s happening. There’s no equivalent of Google Search Console for ChatGPT or Perplexity. No AI platform publishes query frequency data the way Google exposes it through Keyword Planner. Every tool reporting AI search volume is running its own estimation method, and those methods disagree by design, not by error.
There’s No Google Search Console for ChatGPT
Google gives you a number because it can. It owns the query log. ChatGPT, Perplexity, and Gemini don’t share theirs, and there’s no regulatory pressure forcing them to.
That absence is the whole story. Every AI search volume figure you’ve ever seen is modeled, not measured. The question worth asking isn’t “which number is correct.” It’s “which modeling approach is this tool using, and does that approach fit how I plan to use the number.”
Four distinct methodologies currently dominate the market. Each trades off accuracy, cost, and interpretability differently.
Method 1: Keyword Volume Extrapolation
The simplest approach takes a keyword’s existing Google search volume and multiplies it by an estimated AI adoption rate for that topic category. If a keyword gets 10,000 monthly Google searches and the adoption rate for that category sits around 18%, the tool reports roughly 1,800 as the AI-equivalent volume.
This method is cheap to build and easy to explain. That’s its appeal.
It’s also directionally weak. AI platforms are absorbing an uneven 15 to 20 percent of informational query volumeglobally, but that share varies wildly by category, and the adoption rate itself is an estimate layered on top of another estimate. You end up compounding uncertainty rather than resolving it.
Where this actually helps: early-stage GEO planning, when you just need a rough sense of which topics are worth investigating further, not a number you’d defend in a board meeting.
Method 2: Repeated Query Sampling
The second method borrows its logic from election forecasting. You don’t ask one voter. You poll a representative sample repeatedly and track how the distribution shifts.
Tools using this approach define a fixed set of high-intent queries, typically 250 to 500 per brand or category, and run them daily or weekly across ChatGPT, Perplexity, and Gemini. Each run records whether a brand appears as a citation or a plain mention. Over hundreds of runs, the aggregate produces a statistically stable share-of-voice figure.
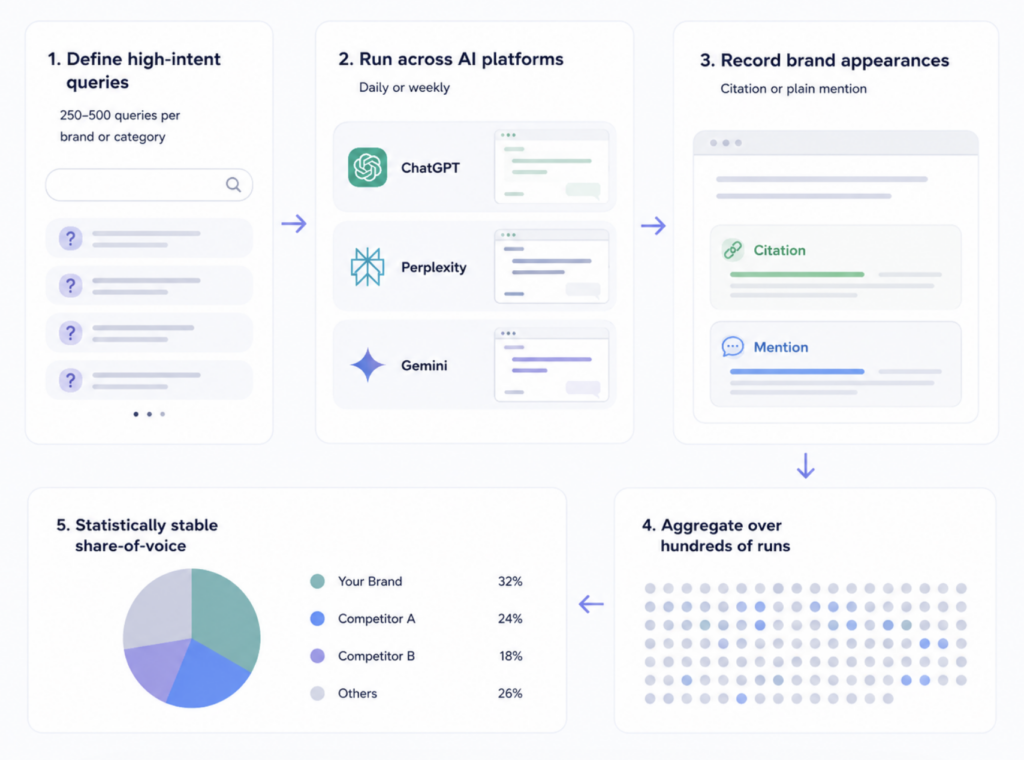
A single screenshot of a ChatGPT answer isn’t your position. It’s one draw from a probability distribution, since LLM outputs vary run to run even for identical prompts.
That’s why the sampling method treats volume less like a fixed number and more like a moving average. Top brands typically capture 15% or more share of voice across their core query sets, and specialized enterprise verticals can reach 25 to 30%.
The trade-off is cost. Running hundreds of queries across multiple platforms on a recurring schedule takes real compute, which is why tools using this method tend to sit at a higher price point than simple extrapolation tools.
Method 3: Semantic Clustering of Observed Prompts
The third method solves a different problem entirely. People don’t type keywords into ChatGPT. They ask full questions, and the same underlying intent can surface in dozens of different phrasings.
“Best design tools for freelancers,” “what software should a solo designer use,” and “affordable design tool recommendations” are the same question wearing three different outfits. Keyword-matching tools would count these as three separate, low-volume queries. Clustering tools embed each observed prompt and group them by semantic similarity, then report one consolidated demand signal for the whole cluster instead of a scattered list of long-tail fragments.
The data feeding this method usually comes from opt-in browser panels and aggregated clickstream data, since that’s currently the closest proxy available to actual prompt logs.
The upside is a more realistic picture of true demand. The downside is that clustering quality depends entirely on how much raw prompt data the tool has access to, and that dataset size varies enormously between vendors.
Method 4: Multi-Source Ensemble Modeling
The most complex approach blends everything above. Proprietary panel data, public market indicators, and partner datasets get combined into a single model, then run through a correction factor designed to offset known biases in each individual source.
The logic is straightforward: any single data source has blind spots, so stacking multiple imperfect sources and statistically adjusting for their known weaknesses should land closer to the truth than trusting one source alone.
This tends to produce the most stable numbers over time, since a spike or dip caused by one input source gets smoothed out by the others. The cost is transparency. The more layers a model has, the harder it is for an outside marketer to explain why a number moved between reports, and that opacity can be a real problem when you’re presenting volume data to a client or exec who wants to know why.
So Which Number Should You Actually Trust
Wrong question. The right one is which methodology matches your use case, your budget, and how much explainability you need.
| Method | Data Source | Update Cadence | Explainability | Best Fit |
|---|---|---|---|---|
| Keyword Extrapolation | Google volume + adoption rate | Static, rarely updated | High, easy to explain | Early topic scoping |
| Repeated Sampling | Live query runs across platforms | Daily or weekly | Medium, statistically grounded | Ongoing share-of-voice tracking |
| Semantic Clustering | Observed prompt panels | Weekly | Medium, depends on data volume | Content and intent mapping |
| Ensemble Modeling | Multiple blended sources | Weekly to monthly | Low, harder to audit | Long-term trend stability |
In practice, the most reliable teams don’t pick one method and stop there. They cross-reference at least two, typically repeated sampling for the day-to-day visibility number and clustering for figuring out which content angles actually match how people phrase their questions.
That’s the design behind Comprehensive GEO Analytics, which pairs volume estimates with visibility, sentiment, and position data in the same view rather than isolating volume as a standalone metric. If you want to see where your own topics land, the AI Search Volume Checker runs the estimate for free before you commit to a full GEO strategy around it. If your volume number spikes but your citation share doesn’t move with it, that gap tells you more than either metric alone would.
AI Search Volume Checker
Conclusion
There isn’t a single correct AI search volume number waiting to be discovered. There are four different modeling approaches, each built on a different set of trade-offs between cost, accuracy, and transparency.
The practical move is to know which method any tool you’re using relies on, then decide how much weight that number deserves in your planning. If a figure from one method disagrees sharply with another, that’s not a bug. It’s two different models looking at the same shadow from different angles. Cross-check before you build a content strategy around either one alone.
FAQ
Q: Is AI search volume the same thing as traditional keyword search volume?
A: No. Keyword volume is a direct count from Google’s own query logs. AI search volume is always modeled, since no AI platform publishes raw query frequency data the way Google does.
Q: Why do different AI search volume tools show different numbers for the same topic?
A: Because they use different methodologies, not because one is broken. Extrapolation, sampling, clustering, and ensemble modeling each weigh data sources differently, so disagreement between tools is expected rather than a sign of error.
Q: How often should I check AI search volume for my key topics?
A: Monthly works for most categories. Fast-moving verticals like AI tools, finance, or breaking news topics often need weekly checks, since prompt patterns in those spaces shift faster than average.
Q: Why does my brand’s AI search volume differ between ChatGPT and Perplexity?
A: Each platform has its own user base, retrieval logic, and citation behavior, so the same topic can generate very different demand patterns depending on which platform’s users are asking about it.