
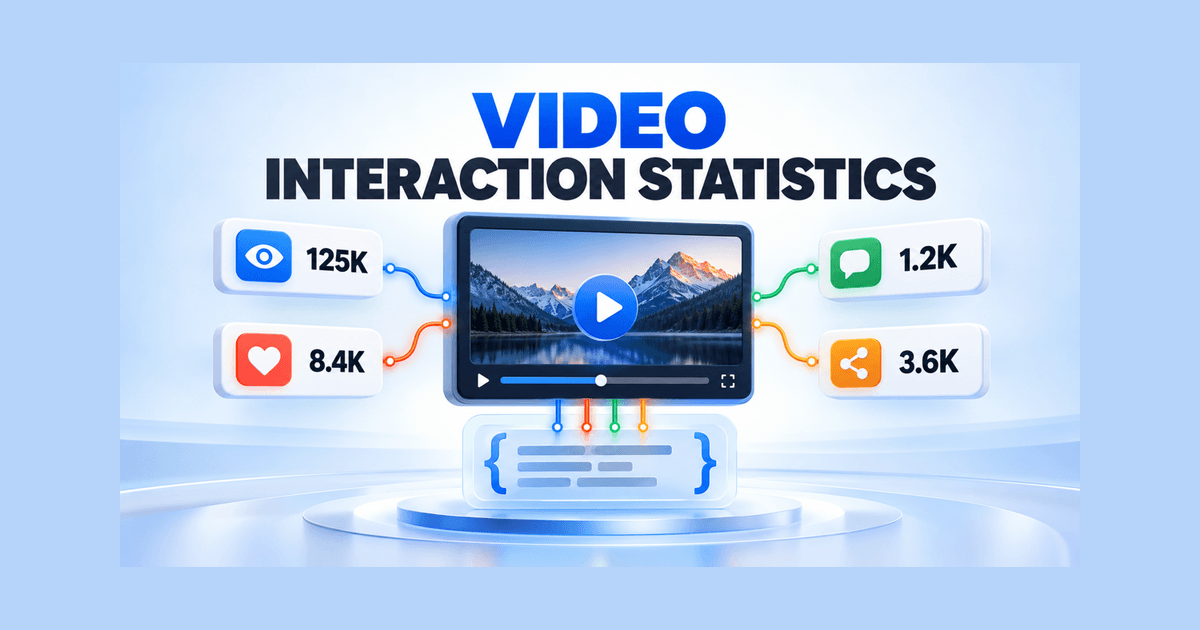
Engagement numbers look simple on a page, but their meaning changes across platforms. A view may count after two seconds or thirty. A share may include private sends, public reposts, or only native buttons. Google now documents additional VideoObject interaction types for likes, comments, and shares alongside views. Video interaction statistics schema can make those visible counts more explicit, but only when the values are accurate and the action types match the metric. This guide explains how to implement the markup without inventing precision or creating a maintenance problem.
What Google Supports for Video Interactions
Google’s September 2026 documentation update expanded the documented VideoObject interaction types. The current Video structured data guide shows interactionStatistic values that can use:
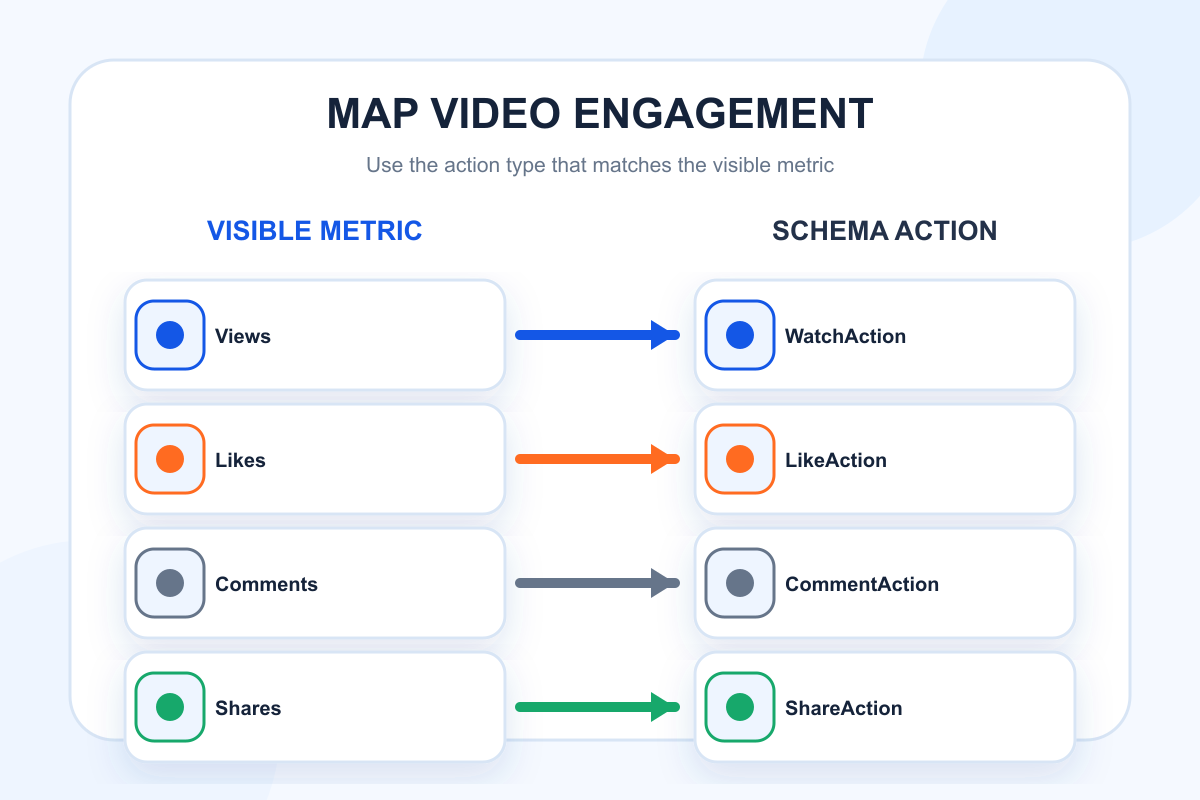
WatchActionfor views.LikeActionfor likes.CommentActionfor comments.ShareActionfor shares.
Each value is generally represented as an InteractionCounter with an interactionType and userInteractionCount. These properties sit inside VideoObject markup. They do not replace the required video fields or basic page eligibility.
Only mark up a metric the publisher can define, display, and maintain. A missing count is better than a misleading one.
Map Each Visible Metric to the Right Action
Begin with the label users see on the page and the event the underlying system counts. Then choose the matching Schema.org action.
| Visible metric | Interaction type | Key validation question |
|---|---|---|
| Views or watches | WatchAction | What event qualifies as a view? |
| Likes or reactions counted as likes | LikeAction | Does the number exclude other reactions? |
| Comments | CommentAction | Are deleted or hidden comments excluded? |
| Shares | ShareAction | Which native or tracked share events are included? |
Do not map impressions to WatchAction unless the platform genuinely treats them as video views and the visible label supports that meaning. Do not combine likes and every reaction under LikeAction if users see a broader “reactions” count. Do not estimate shares from referral traffic.
If the page aggregates interactions from several platforms, explain that visible total and use the same value in markup. If platform rules make the numbers incomparable, show and mark them separately or omit the aggregate.
Add Multiple InteractionCounter Entries
When a page displays several valid metrics, interactionStatistic can contain multiple InteractionCounter objects. A simplified example follows:
{
  "@context": "https://schema.org",
  "@type": "VideoObject",
  "name": "AI Visibility Measurement Tutorial",
  "description": "A tutorial on building a stable AI visibility benchmark.",
  "thumbnailUrl": "https://example.com/images/visibility-video.jpg",
  "uploadDate": "2026-10-17T09:00:00+08:00",
  "embedUrl": "https://example.com/embed/visibility-tutorial",
  "interactionStatistic": [
    {
      "@type": "InteractionCounter",
      "interactionType": { "@type": "WatchAction" },
      "userInteractionCount": 18420
    },
    {
      "@type": "InteractionCounter",
      "interactionType": { "@type": "LikeAction" },
      "userInteractionCount": 906
    },
    {
      "@type": "InteractionCounter",
      "interactionType": { "@type": "CommentAction" },
      "userInteractionCount": 74
    },
    {
      "@type": "InteractionCounter",
      "interactionType": { "@type": "ShareAction" },
      "userInteractionCount": 128
    }
  ]
}
Replace every example value with production data. Keep the metrics numeric and use the action type documented for that event. If only views are available, publish only WatchAction. Completeness does not require manufacturing unavailable values.
Keep Counts Accurate and Current
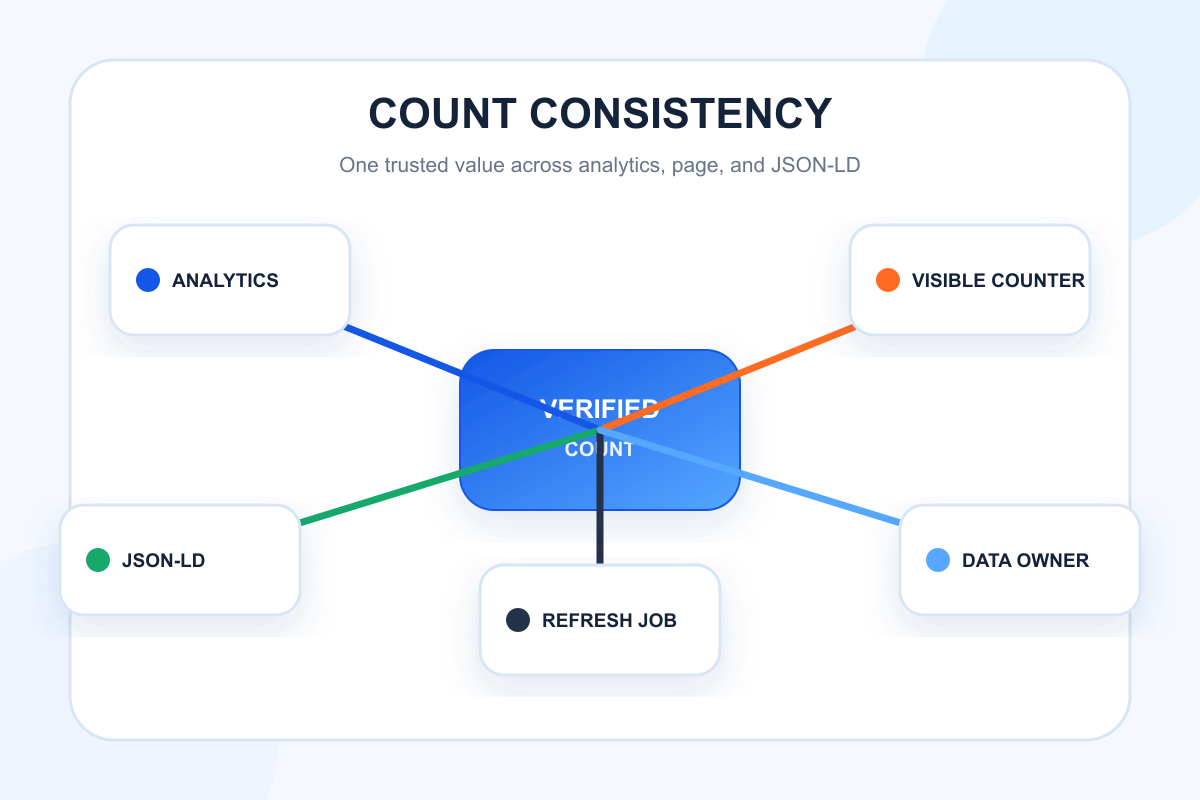
Interaction counts change after publication. Connect structured data to the same trusted source that drives the visible counter when possible. Avoid manual markup values that remain frozen while the page displays a live total.
Document the source field and refresh job for each counter. That small data dictionary gives engineering, analytics, and editorial teams one shared definition when a platform changes its measurement rules.
Define an update cadence appropriate to the page. A high-traffic video may change quickly, while an archive video may need less frequent refreshes. The visible count and JSON-LD do not have to update every second, but they should not materially contradict each other.
Decide how the system handles deleted comments, revoked likes, spam filtering, bot-view removal, and delayed reporting. The goal is not to expose internal event logic in the markup. It is to prevent silent inconsistencies between what the metric claims and how it is calculated.
When a source platform only provides abbreviated display values such as “18K,” the underlying structured-data value can use the exact count if the publisher has it. The visible representation should still be reasonably consistent. Do not infer an exact value from an abbreviation.
Match the Markup to Visible Page Evidence
Google’s structured-data policies require markup to represent page content. Display the engagement metrics users need to verify, or omit unsupported values. Do not add invisible share counts solely because an internal dashboard contains them.
Place the video prominently and keep the basic VideoObject fields accurate. The interaction statistics are enhancements to a valid video description, not a substitute for the name, description, thumbnail, upload date, and content or embed location.
If an embedded third-party player displays counts that the hosting page does not control, confirm that the values are accessible and stable before reproducing them in page-level JSON-LD. Respect the platform’s terms and data definitions.
Validate the Template and Data Pipeline
Use Google’s Rich Results Test to inspect supported video markup and syntax. Validate representative pages for each video template, including pages with no interactions, one interaction type, and all supported types.
Then test the data pipeline:
- Compare the visible count with the source system.
- Compare JSON-LD with the visible count.
- Trigger a sample update and verify refresh timing.
- Test zero values and missing values.
- Confirm that deleted or private videos remove stale markup.
Use automated template tests to catch invalid action names, string-formatted counts, duplicate entries, or empty objects. Monitor Search Console and logs for changes after deployment. A syntax pass proves only that the document can be parsed; it does not prove that the metric is accurate.
Avoid Misleading Engagement Claims
Engagement is easy to manipulate or misinterpret. Do not use schema to present projected views, combined cross-platform numbers without explanation, paid impressions as organic watches, or internal QA plays as audience demand. Remove known invalid activity according to the publisher’s measurement policy.
Do not assume that more interaction markup produces better rankings. Google’s documentation presents these properties as descriptions of the video. Rich-result appearance and ranking depend on many systems. The correct objective is semantic accuracy and a better maintained video data layer.
If business teams want a normalized engagement rate, calculate and explain it in visible analysis. interactionStatistic is designed for event counts, not a custom score whose denominator is hidden.
Use Engagement Data as an Editorial Signal
Once the data is reliable, use it to improve the viewer experience. High views with low completion may indicate a misleading title or weak opening. Many comments may reveal unanswered questions worth addressing in the transcript or a follow-up video. Shares may indicate a practical reference asset.
Topify’s AI Citation Analysis can help teams observe whether video pages or publishers appear as sources in AI answers. That visibility should be assessed separately from on-page engagement. A video can earn strong engagement without becoming a cited source, and a niche expert video can earn citations with modest public counts.
Connect metrics only when a clear hypothesis exists. For example, improving a transcript may increase search discovery and help systems understand the video, but the interaction markup itself does not prove that outcome.
Conclusion
Video interaction statistics schema is useful when it faithfully describes engagement that users can see and publishers can maintain. Map views, likes, comments, and shares to the correct action types, use real numeric counts, synchronize visible and structured values, and validate the full data pipeline. Accurate markup may be less impressive than inflated totals, but it creates a far more trustworthy foundation for video search.
FAQ
Which video interactions can be marked up?
Google currently documents WatchAction, LikeAction, CommentAction, and ShareAction within VideoObject interaction statistics.
Should a page include an interaction type with a zero count?
It can, but omission is often cleaner when a metric is unavailable or not displayed. Use zero only when it is a real, visible value rather than a missing-data placeholder.
How often should interaction counts update?
Use a cadence that prevents a material mismatch between the visible page and JSON-LD. High-traffic videos generally need more frequent updates.
Do interaction statistics improve video rankings?
Google does not guarantee ranking improvements from these properties. They help describe the video and must meet structured-data policies.