A reporting lead sees overall brand visibility fall even though every question group improved. The team checks the arithmetic and finds no calculation error. What changed was the collection: more observations came from the group where the brand was less visible, so the overall result moved in the opposite direction from the individual rates.
An AI visibility report needs to distinguish performance within a group from the weight that group receives in the total. Otherwise, a collection change can look like a broad brand setback. The decision is which aggregate answers the business question, what comparison remains fair, and how to show both results without hiding the actual composition of the sample.
Define the Mix Effect in an AI Visibility Report
A mix effect occurs when an aggregate changes partly because the proportions of its component groups change. Each group’s visibility rate and its share of eligible observations contribute to the total. Looking only at the final percentage hides those separate inputs.
Define the outcome before calculating a rate. For this article’s synthetic example, visibility means an eligible answer mentions the target brand. That is an illustrative binary outcome, not a claim that a mention proves a recommendation, favorable sentiment, or a conversion.
The observed aggregate is total brand-positive observations divided by total eligible observations. It can also be expressed as the sum of each group’s rate multiplied by that group’s share of eligible observations. Those two calculations should agree when the groups form a complete, nonoverlapping partition.
Group improvement doesn’t guarantee aggregate improvement.
The practical question is what your report promises to compare. A result describing this period’s observed collection should retain this period’s actual mix. A result intended to compare group performance under a common composition needs an additional calculation with disclosed fixed weights.
Choose Meaningful Prompt Strata
Use strata that reflect a real distinction in the questions being monitored. For example, category exploration and constrained buying decisions may produce different recommendation patterns. Define the assignment rule before examining which grouping makes the trend look more favorable.
Each observation should belong to one group for this calculation. Overlapping labels can still be useful for other analyses, but adding them as if they were exclusive groups double counts observations. Keep an unclassified category visible when a prompt cannot be assigned reliably.
Use the prompt clustering framework to preserve the underlying decision when grouping questions. Then document the analytic strata separately from editorial topics so a content reorganization doesn’t silently change the reporting calculation.
Keep the grouping definitions stable across the compared periods. A prompt moving from exploration to buying intent changes the composition even when its wording is unchanged. Record that move as a classification change and decide whether a common-rule recalculation is needed.
Don’t create more strata than the collection can support meaningfully. Tiny groups can produce unstable rates and invite explanations based on very few observations. Combine only where the decision meaning remains coherent, and disclose small denominators instead of hiding them in the total.
Recalculate the Aggregate From Counts
Use counts as the source of truth. Adding group percentages or averaging them equally is correct only for a specifically defined equal-weight measure. It generally doesn’t reproduce the observed aggregate when group sizes differ.
The table is a fully synthetic worked example. It contains no measured platform data, customer result, or estimate of real platform performance. Its purpose is to make the reversal reproducible with ordinary arithmetic.
| Prompt group | Period A mentions / eligible | A rate | Period B mentions / eligible | B rate |
|---|---|---|---|---|
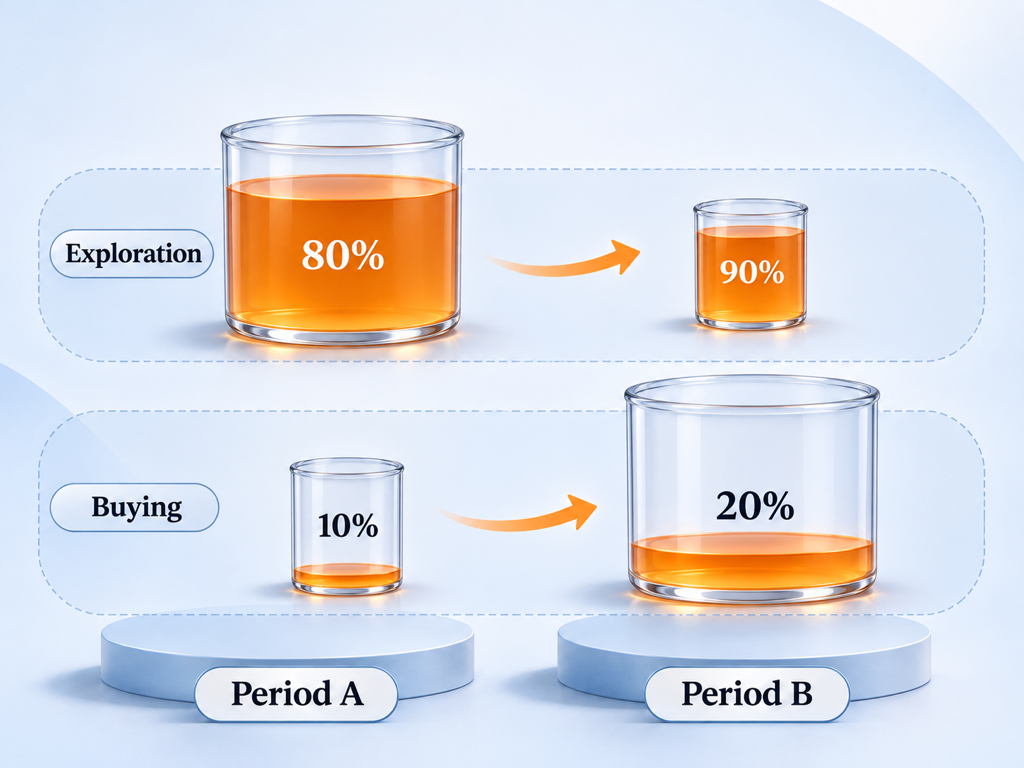
| Exploration | 80 / 100 | 80% | 18 / 20 | 90% |
| Constrained buying | 2 / 20 | 10% | 20 / 100 | 20% |
| Observed total | 82 / 120 | 68.33% | 38 / 120 | 31.67% |
Both group rates improve by ten percentage points. However, the exploration group’s weight falls from 100 of 120 observations to 20 of 120. The lower-rate buying group receives most of the weight in Period B, pulling the observed total downward.
Reproduce the first total by dividing 82 by 120 and the second by dividing 38 by 120. Then verify each group rate from its own numerator and denominator. This simple check separates an arithmetic problem from a composition effect before the team assigns a strategic explanation.
Keep missing and ineligible observations outside the denominator according to a stated rule, and report their counts separately. Changing that rule between periods creates another source of movement. A neat table cannot make an inconsistent eligibility definition comparable.
Compare Observed and Fixed Weights
Fixed weights answer a different question: how would the group rates compare if both periods used the same composition? Choose and document the reference weights before interpreting the result. A prior-period mix, a planned monitoring distribution, or an equal-group view can each serve a purpose, but they aren’t interchangeable.
Using equal weights in the synthetic example gives Period A a standardized rate of 45% and Period B a rate of 55%. That calculation averages the two group rates because the chosen reference assigns each group half the weight. It doesn’t replace the observed totals of 68.33% and 31.67%.
Show both series with clear names. Observed collection visibility describes what was collected; equal-weight standardized visibility describes a common-composition comparison. Calling both simply visibility makes it difficult for a reader to know which decision the chart supports.
Don’t select weights because they reverse an unwelcome result. A reference distribution should have a business reason and a versioned definition. If you change it, explain the change and preserve the earlier calculation rather than silently rewriting the historical story.
A fixed-weight result also needs the underlying groups. When a required stratum is missing in one period, you can’t simply assume its rate. Mark the standardized comparison incomplete or use a clearly disclosed method that matches the decision and its limitations.
Explain an Aggregate Reversal
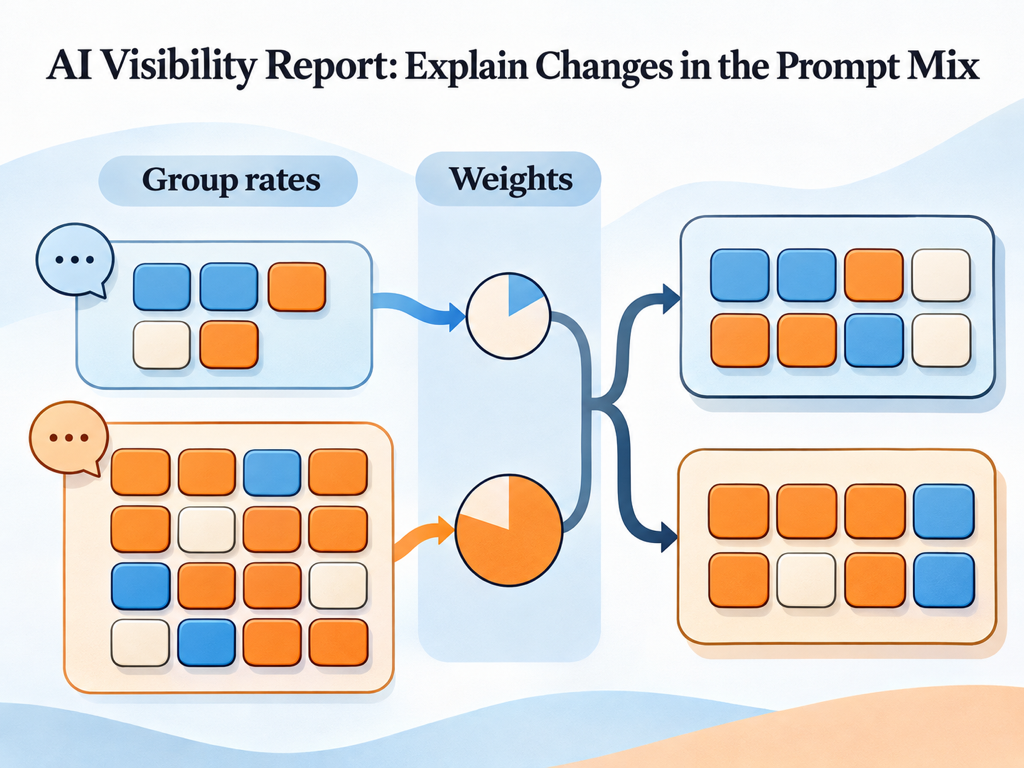
Describe the reversal in two parts. First state what happened to the observed total; then explain how group rates and weights contributed. This structure avoids choosing one result as the real story while dismissing the other as misleading.
For the synthetic example, a useful statement is that observed visibility fell as collection shifted toward the lower-rate group, while both within-group rates improved. The equal-weight comparison also improved. None of those facts establishes why the group rates changed or whether the collection mix represents real buyer demand.
Composition is an explanation of the arithmetic, not proof of market behavior.
Investigate why the mix changed as a separate operational question. The team may have added buying questions deliberately, lost coverage in one group, or changed its sampling schedule. Each explanation has a different implication for the next monitoring cycle.
Avoid reporting the aggregate reversal as a causal decomposition unless your method supports that claim. The worked calculation shows how weights influence the total; it doesn’t isolate the effect of a content campaign, model update, or competitor action. Keep those hypotheses separate from the confirmed count relationships.
Use plain language in the executive note. A stakeholder should understand which group grew in the sample and how that affected the headline number without needing a statistical label. Retain the detailed table for anyone who wants to reproduce the calculation.
Publish the Mix Note With the Result
Topify describes visibility and other AI-search measures in its analytics feature. Use relevant monitored questions and brand outcomes as the starting point, then confirm which observation counts and group fields are available in your actual workflow before calculating a mix comparison.
The analyst’s input is a defined outcome, eligible observations, and stable prompt strata. The action is to reconcile group counts, compute the observed total, and, when justified, produce a separately labeled fixed-weight view. The output helps the team decide whether a headline movement warrants a performance investigation, a sampling explanation, or both. This is an external analytical method, not a claim that Topify automatically calculates the standardized rates used here. Keep the formula, reference weights, eligibility rules, and unresolved coverage gaps with the report so another analyst can reproduce the conclusion.
Pair the calculation note with the business narrative. the executive reporting article provides broader reporting context; the mix note supplies the narrower evidence needed to interpret this particular trend. Name an owner for investigating the collection change and a date for reviewing the next comparable period.
Conclusion
An aggregate visibility change can reflect group performance, sample composition, or both. Recalculate from counts, keep prompt strata meaningful, and distinguish the observed collection from any fixed-weight comparison. A reversal is a reason to explain the arithmetic carefully before assigning a broader business cause.
Choose one recent movement in your AI-search analytics review and build the group-level count table behind it. Check whether the total can be reproduced, then ask whether a common-composition view answers a useful additional question. Publish the weight definitions and missing-data limits beside the result. That gives stakeholders an explanation they can inspect while preserving the actual observations rather than replacing them with a more convenient headline.
FAQ
Can overall visibility fall while every group improves?
Yes. The synthetic example shows how shifting weight toward a lower-rate group can reduce the total even when each group rate increases.
Why should analysts avoid averaging percentages?
An unweighted average doesn’t generally reproduce an observed total with unequal group sizes. Calculate from counts or explicitly define the intended weighting scheme.
When are fixed weights useful?
They help compare group performance under a common reference composition. Explain the reference and show the observed aggregate separately.
What should a report disclose about its prompt mix?
Disclose group definitions, eligible counts, outcome rules, reference weights when used, and missing-data handling. Explain any collection or classification changes between periods.