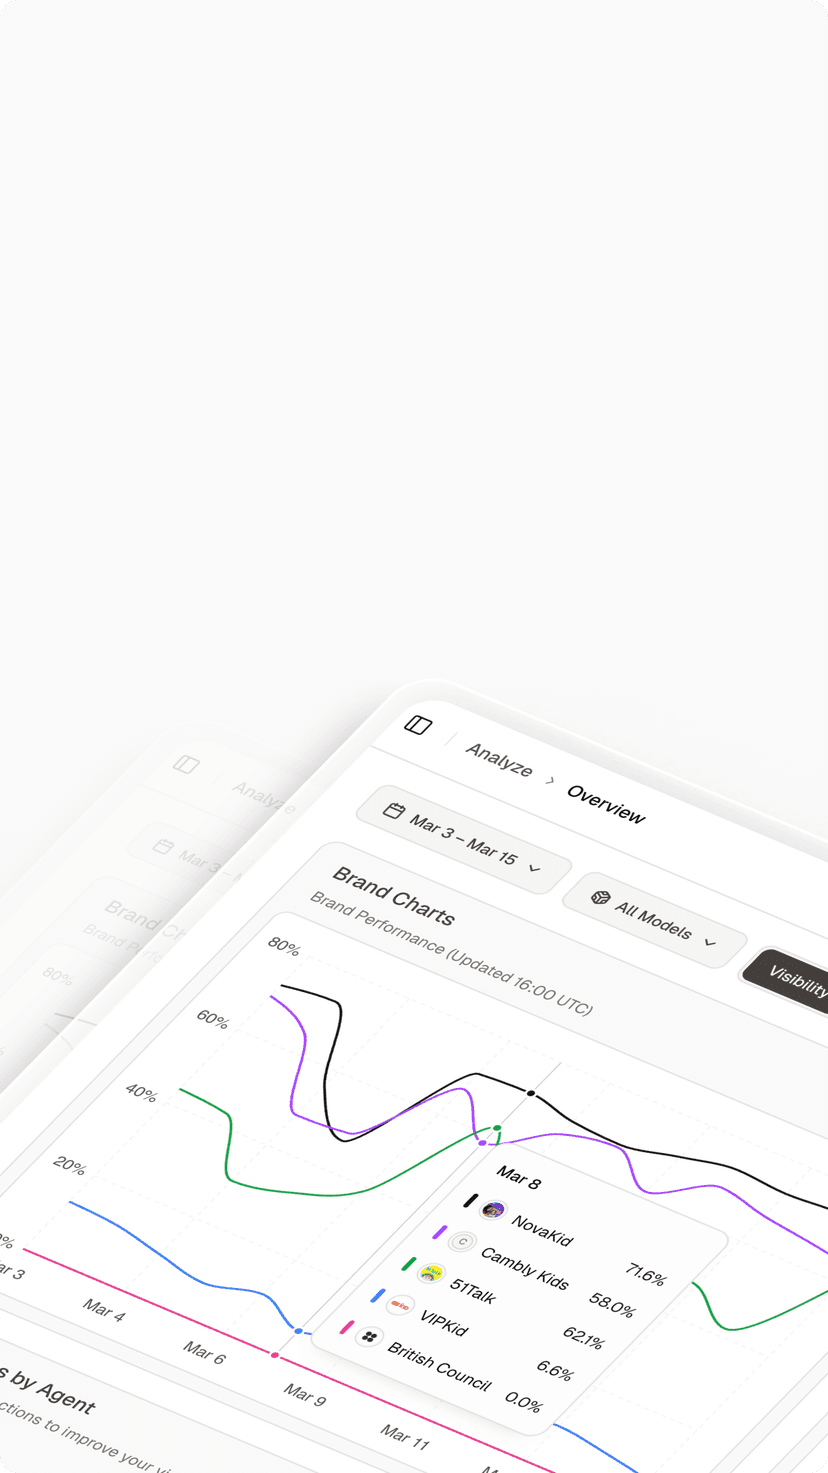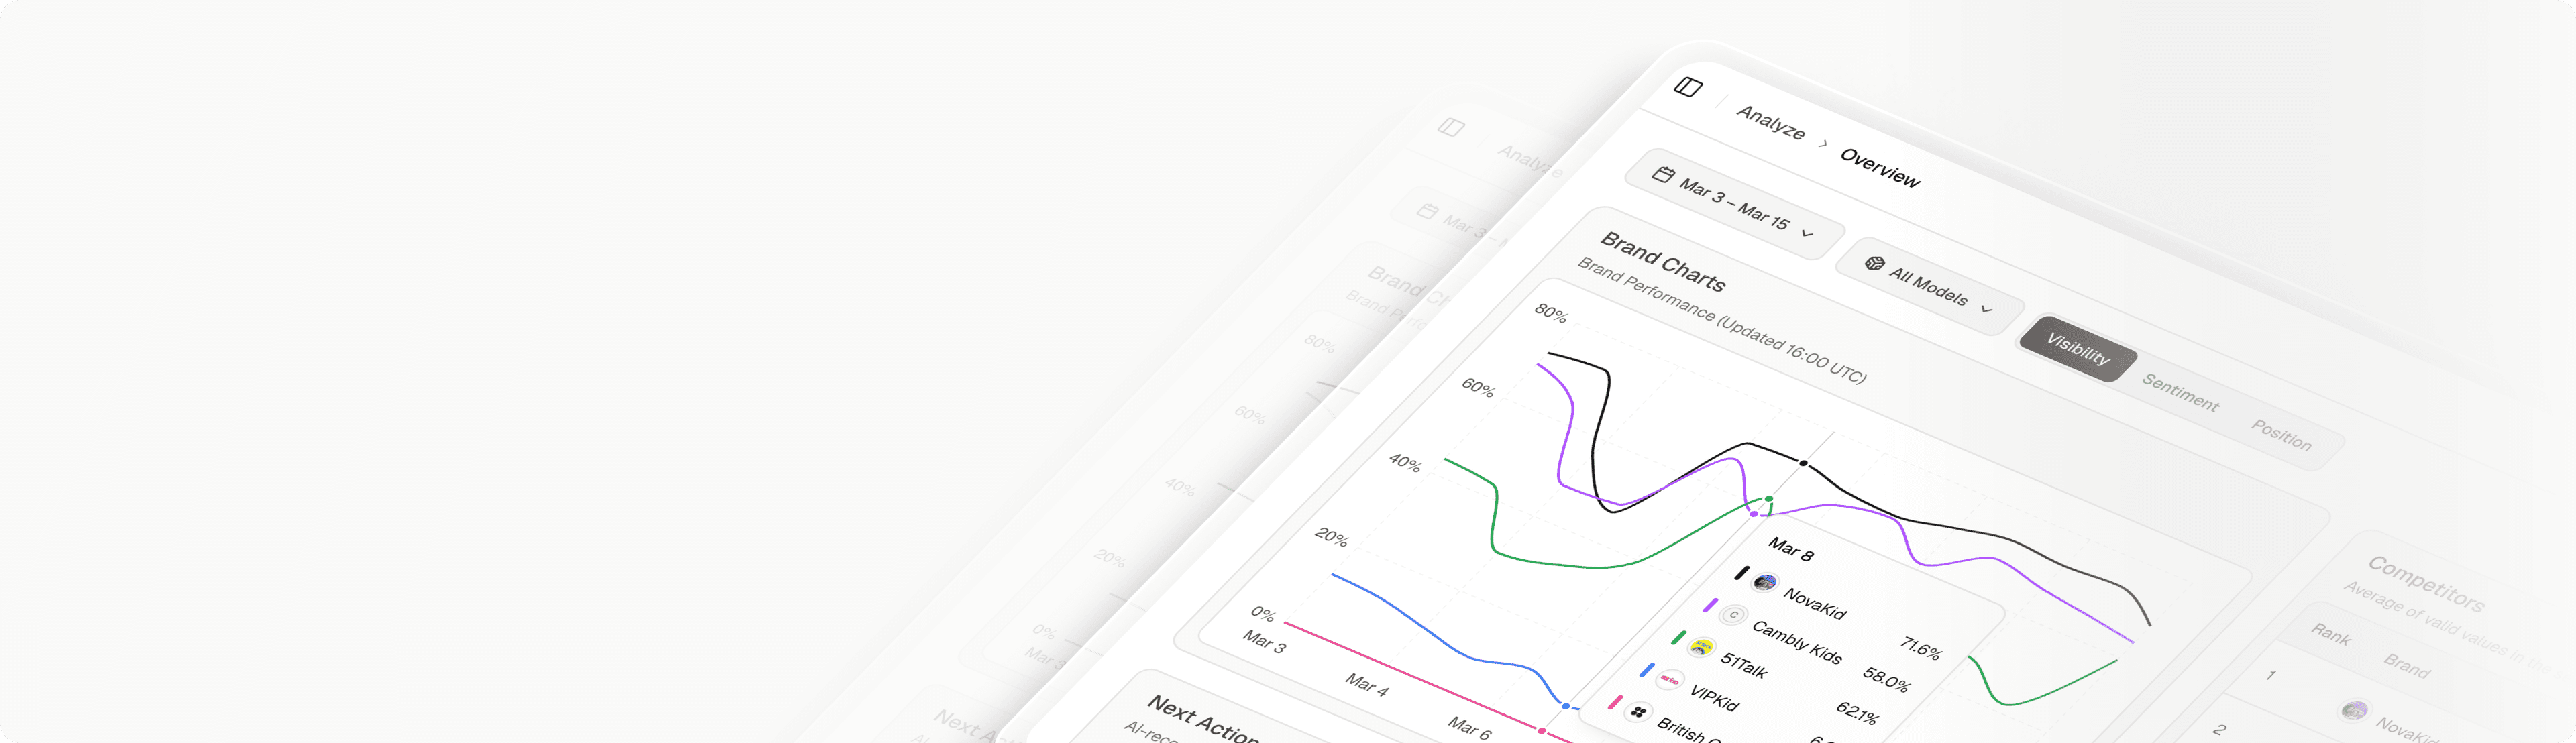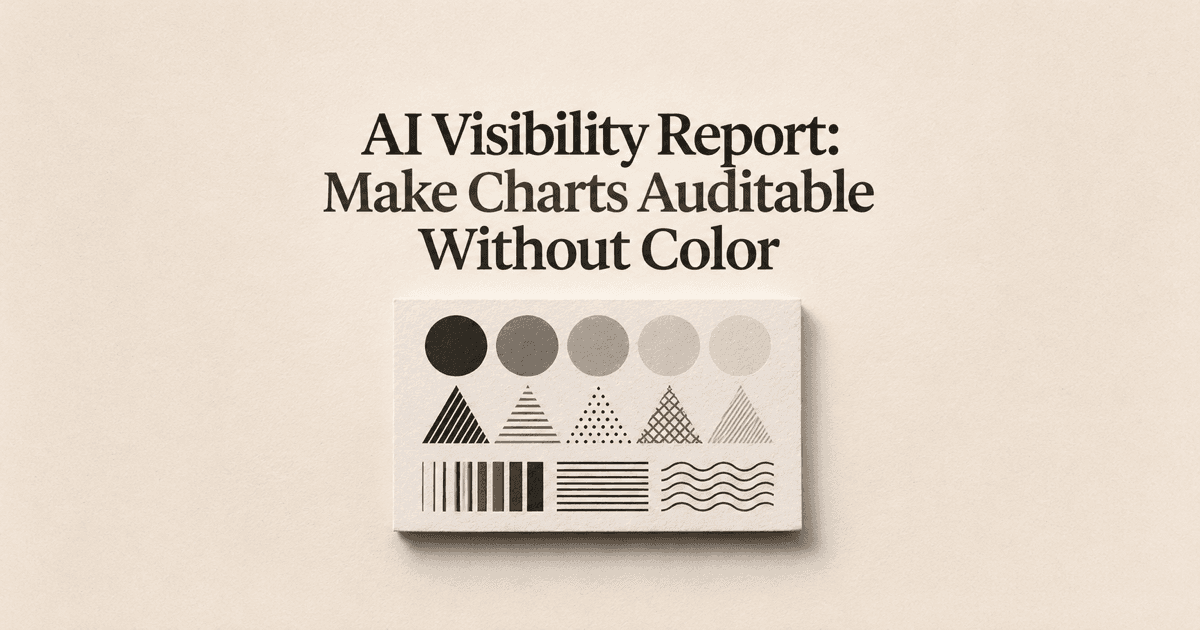
A reporting manager prints a visibility deck before a review meeting and discovers that its red and green series are almost indistinguishable. A colleague reading the shared version can identify the headline but cannot determine which line belongs to the brand. The data may be correct, yet the presentation leaves readers unable to inspect the result independently.
An AI visibility report should communicate its important distinctions through more than color. Labels, shapes, patterns, a useful description, and a matching table help readers recover the same finding in different conditions. Your task is to decide what the chart must convey, preserve that meaning across formats, and keep its supporting evidence aligned with the displayed conclusion.
Define an Auditable Chart in an AI Visibility Report
An auditable chart lets a reader identify the series, understand the measure, and trace the displayed finding to data. Color can contribute to that task, but it shouldn’t be the sole carrier of a meaningful distinction. The chart needs an explicit outcome definition, time range, unit, and scope before visual styling can solve the communication problem.
The WCAG use-of-color criterion addresses using color as the only visual means of conveying information or distinguishing an element. Apply that principle to the chart’s states and series: readers should have another way to tell which result they are inspecting.
Define the minimum message the chart must preserve. For example, a reader may need to identify the target brand, compare it with a reference series, and see which observations are unresolved. Those meanings require distinguishable encodings and clear text, not merely a more attractive palette.
A readable headline doesn’t make the underlying chart reviewable.
Keep accessibility review broader than this one check. A chart that works in grayscale can still have problems with reading order, contrast, keyboard interaction, or its text alternative. This workflow improves specific evidence handoffs; it doesn’t certify the entire report against an accessibility standard.
Add Labels Shapes and Line Patterns
Use direct labels when they reduce the work of matching series to a legend. A short name near a line’s endpoint can remain useful after printing or resizing. Check crowded endpoints carefully so the label doesn’t appear to identify the wrong series.
Combine visual encodings where needed. Solid and dashed lines can distinguish series, while circles and triangles can distinguish point types. Don’t assign so many patterns that readers need to decode a complicated visual language before understanding the comparison.
Represent unresolved observations explicitly. A gap with an explanatory note is different from a zero value, and a distinct marker can identify a documented event. The encoding should preserve that difference when color is unavailable.
Choose patterns that remain visible at the delivered size. A fine dotted line may look distinct in an editing canvas and disappear in a small report card. Review the actual image or document scale your audience receives.
Use a brief encoding key when the design requires one. State what the shapes or patterns mean and apply them consistently across the report. Consistency reduces the risk that a reader mistakes an uncertainty marker on one page for a competitor series on another.

Write a Description That Explains the Result
A description should identify the chart’s subject and summarize the finding needed for the decision. The WAI guidance for complex images discusses short identification together with a fuller description for detailed information. Use that distinction to avoid squeezing an entire data series into a tiny label.
Describe the scope before interpreting movement. Name the metric, compared periods, included question group, and relevant exclusions. Then state the main change and any limitation that affects its meaning, such as incomplete collection or a changed denominator.
Keep observed results separate from explanations. A description can say that the displayed brand-presence rate declined within the stated sample. It shouldn’t attribute that decline to a competitor action unless the report includes evidence supporting the causal claim.
A synthetic description might say that the solid-line target series rises between the two complete periods, while the dashed reference remains approximately level. If the final period is incomplete, say so directly rather than leaving readers to infer the meaning of a lighter color.
Don’t rely on directional phrases alone. The green line on the left may become meaningless in a printed or linearized version. Use stable series names and report labels that remain understandable without the picture’s position or color.
Provide a Matching Data Table
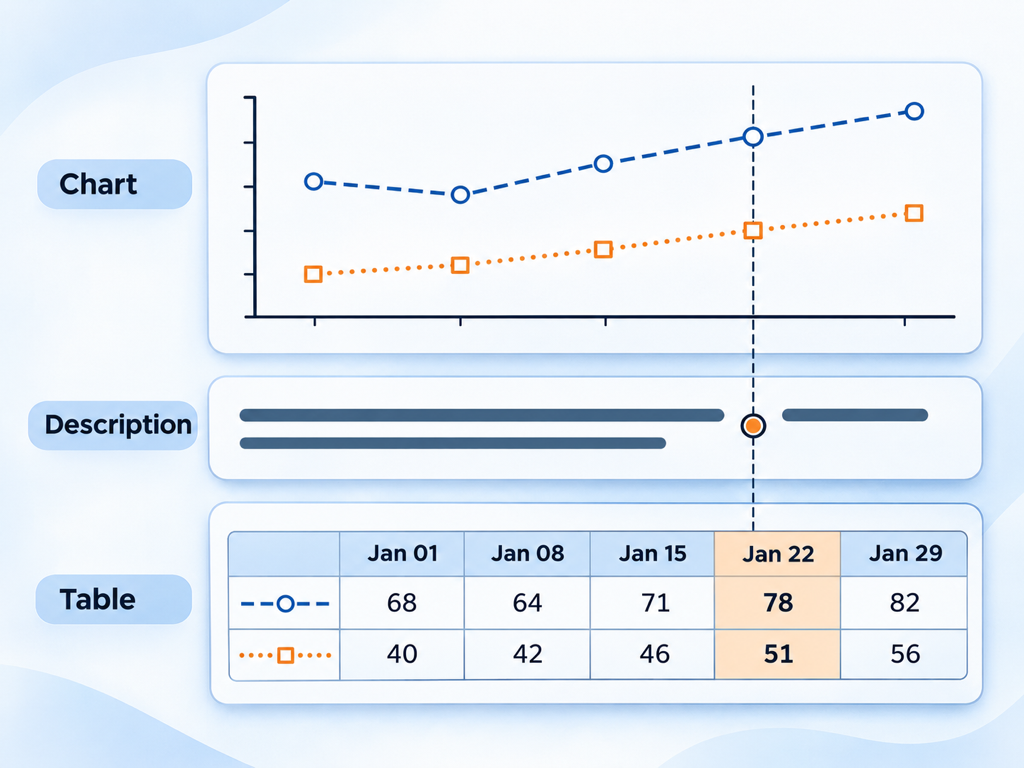
The table should reproduce the chart’s measure and scope. A chart showing a percentage of eligible answers needs the corresponding eligible counts and numerator where available. A table of total prompts from a different filter doesn’t provide a reliable audit path.
Give the table a clear caption or nearby explanation. Identify the reporting window, timezone when relevant, platform scope, and missing-data treatment. Readers shouldn’t need to compare several footnotes to discover that the chart and table cover different periods.
Use the following checklist as a mapping between visual distinctions and evidence fields. It is a proposed publishing checklist, not a description of automatic output from any analytics product.
| Chart meaning | Noncolor presentation | Matching evidence field |
|---|---|---|
| Brand or comparison series | Direct name and line pattern | Series name and stable identifier |
| Observed rate | Position on a labeled axis | Numerator, eligible denominator, rate |
| Missing observation | Gap or distinct marker with text | Missing status and reason |
| Collection period | Explicit date labels | Start, end, and completeness |
| Filtered scope | Caption naming the included group | Platform, market, and prompt-group fields |
| Method change | Labeled annotation | Effective date and method note |
Keep missing distinct from zero in both media. A zero can mean an observed eligible sample contained no positive outcomes; missing means the record cannot supply that observation. Replacing one with the other changes the finding, regardless of how accessible the chart looks.
Check rounding as part of reconciliation. Displayed percentages may differ slightly from a calculation based on rounded intermediate values. Retain the underlying counts, use a stated rounding rule, and make sure the report doesn’t imply more precision than the collection supports.
Test Grayscale and Reading Order
Review the delivered artifact in grayscale at its intended size. Ask whether a reader can identify every decision-relevant series and state without using color. Inspect labels, markers, line intersections, and uncertainty notes rather than checking only the overall appearance.
Then review the information in a linear sequence. A reader encountering the heading, short identification, description, and table should be able to recover the main result and its evidence. Make the series names and date labels consistent so the sequence doesn’t require visual guesswork.
A second reviewer is useful for this test. Give them a concrete task, such as identifying the target series and finding its denominator, without explaining the intended answer first. Record where they become uncertain and revise the artifact around that friction.
The alternative representation must preserve the conclusion’s limits.
For example, a description that says visibility improved while the chart marks an incomplete final period removes an important qualification. The same limitation should appear wherever the finding is communicated, including the table note and executive summary.
Use the executive reporting discussion for the broader decision narrative. Keep the noncolor and reconciliation review as a separate publishing check so a persuasive story doesn’t substitute for inspectable evidence.
Publish the Chart With Its Evidence
Topify describes visibility, sentiment, position, and source analysis through its AI-search analytics feature. Choose the measure relevant to your question, then verify the fields available in your actual output before building a chart and matching table. Avoid mixing different measures simply because they share a similar visual scale.
The input is a defined set of observations and an explicit reporting question. The analyst’s action is to reconcile the data, assign noncolor encodings, and write an equivalent description; the output is a finding a reader can inspect through several representations. That workflow can support a clearer content or monitoring decision, but it doesn’t establish that Topify automatically produces accessible exports, supplies every denominator, or certifies report compliance. Keep manual presentation work and unavailable fields visible. When a required audit field is missing, narrow the displayed claim or obtain the evidence before publishing the comparison.
Bundle the chart with its description, table, method note, and update date. Give the artifact a version identifier when it will circulate beyond the original meeting. That helps reviewers distinguish the corrected version from an older screenshot with a different scope or missing explanation.
Conclusion
An inspectable visibility chart preserves its meaning when color is unavailable and gives readers a route back to the underlying evidence. Use direct names, distinguishable patterns or shapes, an equivalent description, and a table with matching scope. Keep missing observations, incomplete periods, and denominator limits consistent across all those representations.
Choose one chart from your AI-search analytics reporting workflow and review its delivered version in grayscale and in reading order. Ask a colleague to identify the target series and verify one displayed value from the table. Repair the points where that task fails, then publish the chart and supporting material together. This creates a practical review standard without treating a single visual check as proof of complete accessibility compliance.
FAQ
How can chart states be distinguished without color?
Use direct labels, line patterns, shapes, and explanatory text. Test those distinctions at the size and format readers will receive.
What belongs in a chart description?
Identify the subject, measure, scope, main finding, and consequential limitations. Use stable series names rather than relying on color or position alone.
Should every chart have a matching data table?
For an auditable visibility report, a table is a useful evidence path. Match the chart’s filters, periods, units, and missing-data rules rather than attaching an unrelated export.
Does passing a grayscale check prove accessibility compliance?
No. It checks one aspect of communication. Reading order, text alternatives, interaction, contrast, and other requirements need their own appropriate review.