A content operations analyst adds the estimated demand for several closely related buyer questions. The total looks large enough to justify an entire publishing program, but nobody can explain whether the rows describe distinct messages, overlapping topics, or alternate labels for the same underlying demand. The spreadsheet is precise while its meaning remains uncertain.
AI search volume is useful only when the aggregation respects the unit being estimated. Related prompts may belong together editorially without forming independent quantities that can be added. The immediate task is to document what each row represents, identify overlap, and decide whether a total, a range, or separate figures is the most defensible output.
Define the Unit Behind AI Search Volume
Write a measurement sentence for the estimate: what is counted, over which period, on which platforms, and for which population? A label such as monthly demand doesn’t answer whether the unit is messages, conversations, users, or a modeled topic quantity.
These units behave differently. One person can send several messages in a conversation, and one message can contain several tasks. A family of related questions can therefore be meaningful for content planning without representing a distinct set of users.
OpenAI’s Signals individual data illustrates why scope matters: its published data uses a defined personal-account sample and excludes enterprise and Codex usage. Those boundaries support interpretation of that dataset, not a universal count for any commercial prompt.
Keep the estimate’s label and source wording in the ledger. Add your own normalized unit only when the documentation supports it. An ambiguous number should remain ambiguous until clarified, rather than being assigned a convenient unit to make the spreadsheet work.
Check Whether Rows Are Disjoint Before Summing
Addition is appropriate when the rows describe distinct quantities under compatible definitions. Two nonoverlapping categories in the same population and time window may be additive. Two estimates for alternate phrasings of one topic may not be.
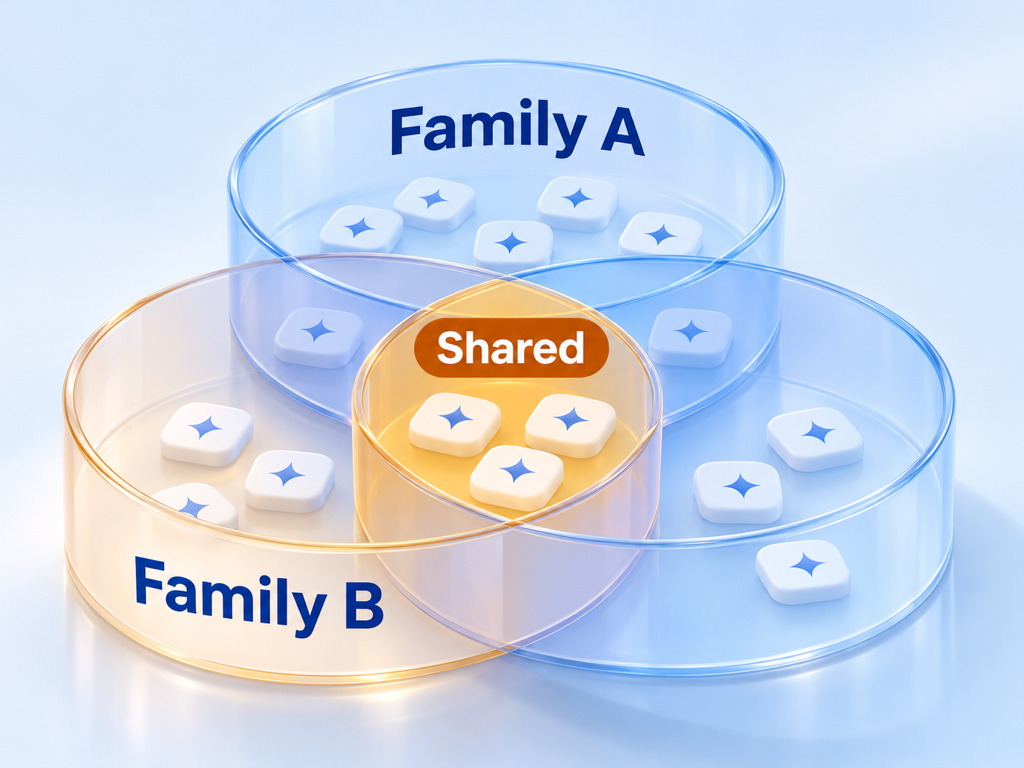
Check for three relationships: separate sets, overlapping sets, and parent-child categories. A broad “team scheduling” estimate may already include a more specific “shift scheduling for support teams” estimate. Adding both can count part of the same underlying quantity twice.
Google’s Keyword Planner metric definitions provide a useful comparison: average monthly searches can include close variants and depend on selected settings. That doesn’t establish how an AI-volume provider handles variants; it shows why a visible row isn’t automatically an independent unit.
Ask the provider what happens when related prompts are submitted separately. Does each return an independent estimate, a shared family estimate, or a conditional allocation? If the answer isn’t disclosed, don’t infer it from similar-looking results.
Editorial grouping and mathematical additivity need separate approval.
Create a Family Ledger With Explicit Membership
Assign each row an estimate identifier, original prompt, family label, source, collection date, and measurement scope. Preserve the original wording so a reviewer can distinguish an editorial grouping decision from a provider’s measurement definition.
Add an aggregation status such as additive, overlapping, nested, or unknown. Support that status with documentation or an explicit analytical assumption. A similarity score alone doesn’t establish that two demand estimates overlap by a measurable amount.
For a hypothetical family, several prompts might concern choosing a scheduling tool for a support team. One row may add a specific integration condition. Keep that constraint visible even if the editorial plan treats the prompts as related; it can represent a different buying decision.
| Row relationship | Can the figures be summed? | Evidence needed | Safer reporting choice |
|---|---|---|---|
| Documented disjoint categories | Usually, with matched scope | Compatible units and explicit separation | Total with definition |
| Parent and included child | Not without adjustment | Membership and allocation rules | Parent plus child breakdown |
| Overlapping families | Not as a simple total | Intersection or deduplication method | Deduplicated union or qualified range |
| Same topic, unclear provider rules | Unknown | Provider methodology | Separate estimates with a caveat |
| Different populations or units | No direct sum | A valid conversion or common basis | Separate views |
Use the ledger to decide what the planning team is allowed to report. This is narrower than deciding how to cluster prompts for writing. One article can serve several related questions even when the underlying estimates cannot be combined into a single defensible total.
Calculate Bounds When Overlap Is Unknown
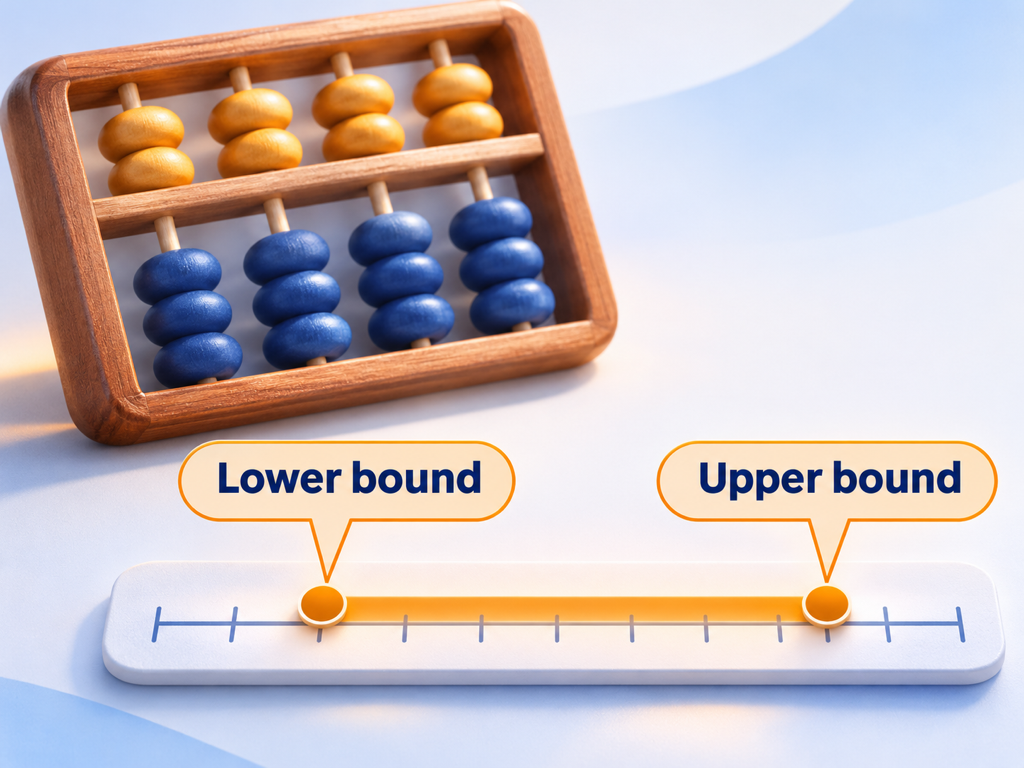
Bounds can illustrate uncertainty when the quantities refer to compatible sets. For two exact set counts from the same population and period, the union cannot be smaller than the larger set or larger than their sum. The overlap determines where the union sits between those limits.
In a hypothetical example, one set contains one hundred messages and another contains sixty. With no intersection information, their union lies between one hundred and one hundred sixty messages. This arithmetic is an illustration of set relationships, not a measured demand estimate.
The assumptions matter. If one number is users and the other is messages, those bounds don’t apply. If the figures are modeled estimates with error, the simple interval doesn’t capture the uncertainty in the estimates themselves.
Avoid presenting the maximum row as the family total. It can be a lower bound under the stated exact-count conditions, but the union may be larger. Similarly, the sum is an upper bound under those conditions, not evidence that every row is independent.
Report the assumptions beside any range. When the measurement basis is unclear, separate figures can be more honest than a numerical interval that appears rigorous but lacks the necessary common population and unit.
Keep Demand Estimates Separate From Monitoring Runs
A monitoring run is an observation your team requests. Repeating a prompt many times can help investigate answer behavior, but it doesn’t establish that real users asked that prompt the same number of times.
Keep collection volume, answer visibility, and demand estimates in different fields. A team might collect twenty responses to examine stability while using a separate estimated demand signal for prioritization. Adding those responses to the demand estimate would combine unrelated units.
The same caution applies to source citations. A prompt can generate several cited URLs, and repeated observations can generate many source occurrences. Those counts describe the monitored answers, not necessarily the number of searches or buyers in the market.
The related AI Search Volume Has Three Meanings. Buying the Wrong One Costs You provides context for metric ambiguity. This aggregation workflow adds a specific constraint: even correctly named estimates need compatible membership before they can be summed.
Give every report column a unit and a scope. That small discipline helps prevent a planning workbook from mixing true demand estimates with the activity generated by the research process itself.
Use Topify Estimates With an Aggregation Note
Topify describes estimated monthly prompt demand through its AI Search Volume Checker. Start with a real buyer question and preserve the prompt, returned estimate, platform scope, and collection date. Bring related questions into the family ledger while keeping each original result intact, rather than immediately adding their figures into a topic total.
Use the estimates as one input to content prioritization alongside intent and evidence gaps. The output should state whether figures are separate, additive under documented rules, or subject to unresolved overlap. The public tool description doesn’t establish a cross-prompt intersection matrix or a deduplicated union for every family, so the aggregation policy proposed here remains an analyst-managed control. Ask for clarification when a consequential total depends on an undisclosed relationship.
For editorial grouping, AI Prompt Clustering: How to Group Buyer Questions Without Hiding Intent provides a related framework. Keep that decision linked to the ledger while distinguishing the page-planning question from the mathematical quantity reported to leadership.
Conclusion
A useful demand report starts with units and membership. Document what each estimate represents, align its scope, and determine whether related rows are disjoint, overlapping, nested, or unknown. Only then choose a total, a carefully qualified range, or separate figures. Don’t let the convenience of a sum decide the measurement definition.
Start with one prompt family and preserve the original results from an AI search volume estimate. Add the aggregation status and assumptions beside each row, then review whether the proposed topic total is supported. The next planning decision will have a clearer evidence basis even when the most accurate conclusion is that a precise combined figure remains unavailable.
FAQ
Can estimates for similar prompts be added?
Only when compatible definitions and membership support addition. Similar wording doesn’t prove either independence or a known amount of overlap.
Is the largest row the demand for the whole family?
Not automatically. Under compatible exact-set assumptions it can be a lower bound, but the family union may be larger and modeled estimates introduce additional uncertainty.
What can I report without overlap data?
Keep the estimates separate and explain the unresolved relationship. Use bounds only when the required common population, unit, period, and counting assumptions are justified.
Do repeated monitoring runs count as search demand?
No. They describe your research activity. Keep run counts, answer appearances, and user-demand estimates as distinct measurements.