Your Google Analytics dashboard looks fine. Traffic is up. Engagement is decent. But somewhere between your reports and reality, a growing category of high-intent visitors is slipping through untracked, showing up as “Direct” with no referral context, no source, no campaign. They came from ChatGPT or Perplexity. You’ll never know.
That’s not a GA4 configuration problem. It’s a structural gap in how website traffic analysis was designed, and in 2026, it’s getting harder to ignore.
This guide covers the full picture: how to read traditional traffic data well, how to diagnose drops, how to connect analytics to performance, and how to account for the channel your current stack can’t measure.
The 6 Traffic Sources You Need to Track (One Keeps Growing Invisibly)
Most teams still operate with a five-channel mental model: Organic Search, Direct, Referral, Social, and Paid. That model was accurate until about two years ago.
As of Q1 2026, AI-referred traffic accounts for 12% to 18% of total global web referral traffic, up from 5-8% in late 2024. That’s 150-200% year-over-year growth. It’s no longer a rounding error.
Here’s the problem. AI-referred traffic doesn’t travel cleanly. When a user clicks a link inside ChatGPT’s paid interface, the platform strips the referrer header. GA4 logs the session as “Direct.” The visitor came pre-qualified, already past the evaluation phase, ready to engage. You just have no idea they exist.
Organic search still drives approximately 46.98% of global web traffic, and it remains the backbone of any sustainable acquisition strategy. But the gap between “search volume” and “clicks” is widening fast. More on that shortly.
How to Use GA4 for Website Traffic Analysis
GA4 is more capable than most teams give it credit for, but it rewards specificity. The default reports are a starting point, not a finish line.
The most common mistake is conflating the User Acquisition and Traffic Acquisition reports. They answer different questions. User Acquisition is scoped to the first session: it tells you how a person originally discovered your site. Traffic Acquisition is session-scoped: it tells you what drove each individual visit, new or returning.
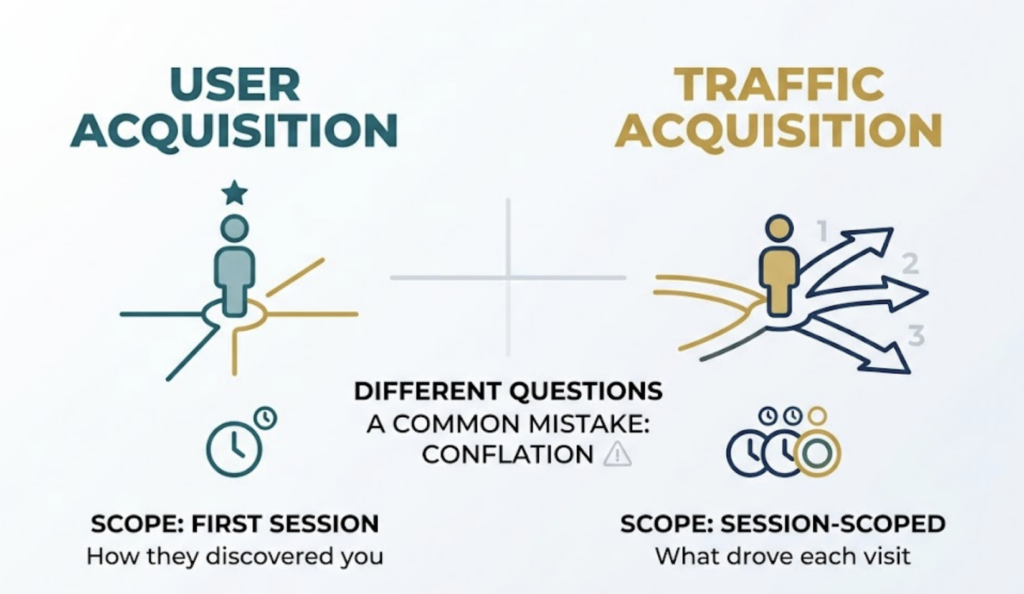
That distinction matters when you’re measuring attribution. A user who discovered you via organic social, then converted three weeks later through a newsletter click, will show up differently in each report. One credits social. One credits email. Neither is wrong. They’re just answering different questions.
For most practical traffic analysis, start with Traffic Acquisition. Filter by channel, segment by landing page, and correlate with engagement rate. If you’re measuring the long-term payoff of brand campaigns or awareness content, switch to User Acquisition.
What GA4 Still Can’t Tell You
GA4 has a structural attribution problem in the AI era. Research across millions of sessions found that approximately 22% of ChatGPT sessions and 32% of Perplexity sessions are categorized as “(not set)” or absorbed into Direct traffic. The referrer data simply doesn’t transfer.
This isn’t a bug you can fix with better UTM hygiene. It’s an architectural reality of how major AI platforms handle outbound links.
How to Read Organic Traffic Data and Find What’s Actually Working
Google Search Console is the most underused tool in the average analyst’s stack.
Most teams look at clicks and call it done. The real signal is in the Impressions vs. Clicks ratio. A page with 50,000 monthly impressions and 300 clicks isn’t performing well. It’s ranking for queries where nobody needs to click. That distinction changes your optimization strategy entirely.
AI Overviews now appear in over 40% of U.S. queries, and when they’re present, the CTR for traditional results drops from a baseline of 15% to 8%. For informational queries, you may be “winning” in impressions while losing in traffic.
The practical implication: look for pages where you rank in positions 4-10 with solid impressions. Those are your highest-leverage CTR optimization targets. Rewrite the meta title and description to address the specific intent, not just match the keyword.
For identifying which pages get the most traffic, GA4’s Landing Page report (under Engagement) gives you session volume by entry point. Sort by sessions, then cross-reference with average engagement time. High traffic plus low engagement usually means either wrong audience or misaligned content.
How to Diagnose a Traffic Drop Before Your Boss Asks
Traffic drops tend to have three possible causes: algorithm, technical, or content. They rarely announce which one.
The December 2025 Core Update introduced stricter AI content detection, targeting pages with what Google classified as “generic phrasing patterns” and thin E-E-A-T signals. Sites that dropped 50% or more typically lacked verifiable author credentials, original research, or first-hand experience signals.
Start with this sequence when diagnosing a drop:
First, check GSC’s Coverage report for new “Crawled – currently not indexed” pages. If previously indexed content is being excluded, that’s a signal, not a coincidence.
Second, check Core Web Vitals. Sites with an LCP exceeding 3 seconds experienced 23% more traffic loss than faster competitors in the December 2025 cycle. What looks like a content penalty is sometimes a performance regression from a recent deploy.
Third, look at whether the drop is query-wide or page-specific. A broad organic decline across dozens of pages suggests an authority or algorithm signal. A drop on a single cluster of pages usually points to content quality or cannibalization.
Fourth, check for seasonality before escalating. A March traffic dip for a retail brand is rarely newsworthy.
Document what you find against a 12-month calendar view in GA4. Comparing week-over-week without accounting for seasonal patterns produces a lot of false alarms.
The Traffic Your Analytics Dashboard Can’t See
This is the part most website traffic analytics guides skip.
ChatGPT now processes more than 2.5 billion prompts daily. Google AI Overviews reach 2 billion users monthly. A material portion of your potential customers are discovering, evaluating, and selecting brands inside conversational AI interfaces before they ever touch a search result page.
When that discovery happens and the user clicks through to your site, your GA4 shows “Direct.” There’s no source. No medium. No referral path. The influence of the AI recommendation is invisible in your reporting.
That invisibility compounds. Users who learn about a brand from ChatGPT often don’t click immediately. They’ll search your brand name on Google later. GA4 attributes that session to “Organic Search,” hiding the original AI influence entirely. This is sometimes called the Branded Search Cascade, and it systematically understates the value of AI-channel visibility.
Topify was built to solve this specific gap. Rather than crawling SERPs, it probes LLM interfaces directly, tracking brand mentions, recommendation positions, and sentiment across ChatGPT, Gemini, Perplexity, and other major AI platforms. The platform’s Visibility Tracking feature monitors how often your brand appears in AI responses to relevant queries. Its AI Volume Analytics surfaces the actual prompt clusters your target audience is using, based on real AI search behavior rather than estimated keyword volumes.
For teams that are already good at GA4 and GSC, this is the layer that fills the remaining blind spot. It answers the question your current stack structurally cannot: is your brand being recommended by AI, and what does that look like compared to your competitors?
How to Connect Traffic Data to Marketing Performance
Traffic volume is a leading indicator. Revenue is the lagging one. The teams that lose credibility in reporting are the ones who treat the two as the same.
The practical framework: measure traffic at the channel level, engagement at the page level, and conversion at the funnel level. Each layer has a different owner and a different optimization lever.
For content specifically, the cleanest way to measure impact is to track organic sessions to a page over the 90 days following publication, then compare against a pre-publication baseline. This controls for seasonality without needing a complex cohort model.
UTM parameters are non-negotiable for any traffic source you control. Every link in email campaigns, social posts, and paid placements should carry campaign-level tags. Default GA4 groupings for these channels are inconsistent and often wrong.
B2B companies with structured lead generation processes see 133% more revenue than those without. Most of that gap isn’t channel selection. It’s attribution discipline. Teams that know exactly which content and channel combinations drive pipeline make better investment decisions, full stop.
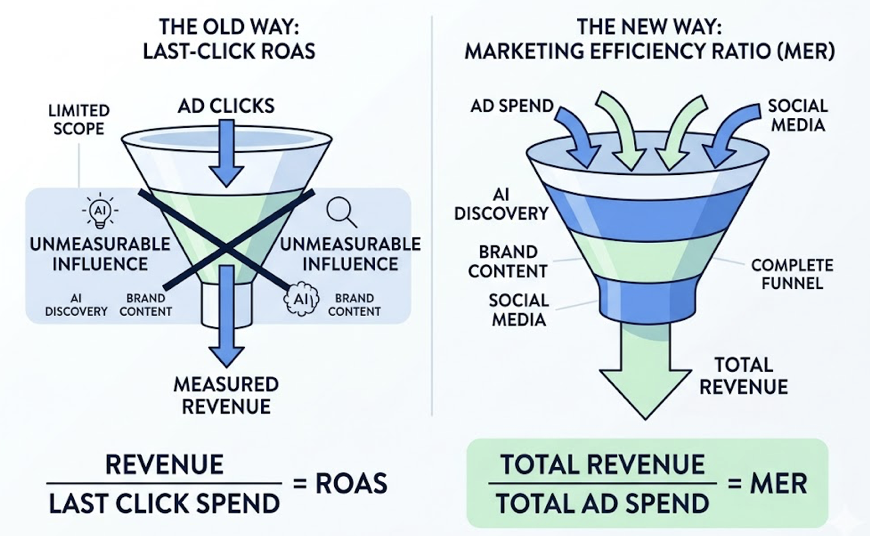
The metric worth adopting at the leadership level is Marketing Efficiency Ratio (MER): total revenue divided by total ad spend. Unlike Last-Click ROAS, MER accounts for unmeasurable influence channels like AI discovery and brand awareness content. It gives leadership a denominator that reflects how the modern funnel actually works.
Website Traffic Analysis Tools: A Practical Comparison
You don’t need a six-figure analytics stack to do this well. You need the right tools for the right questions.
GA4 + Google Search Console are the non-negotiable foundation. GA4 covers on-site behavior. GSC covers search visibility and index health. Together, they answer 80% of day-to-day traffic questions. Both are free.
For competitive traffic analysis, Semrush’s database of 25 billion keywords makes it the standard for identifying content gaps and tracking ranking movements. SimilarWeb is better suited for market share analysis and understanding competitor referral sources at scale. Both have SMB-tier pricing, but enterprise features carry enterprise costs.
For AI visibility tracking, these tools have limited coverage. That’s where specialized platforms like Topify fill the gap. Traditional SEO tools weren’t designed to probe LLM query interfaces. They measure what happened on SERPs. Topify measures what’s happening inside the AI conversation before the user ever reaches a SERP.
| Tool | Primary Use Case | AI Visibility | Cost Profile |
|---|---|---|---|
| GA4 | On-site behavior tracking | None | Free |
| Google Search Console | Organic search visibility | Limited | Free |
| Semrush | SEO/PPC tactical execution | Emerging | SMB-friendly |
| SimilarWeb | Market share & competitive research | Limited | Enterprise-focused |
| Topify | AI-channel visibility & GEO | Full coverage | AI strategy-first |
For small businesses doing website traffic analysis with a limited budget, start with GA4 and GSC. Add a competitor tool when you have a clear content strategy to validate. Layer in AI visibility tracking when you’re ready to measure the channel that’s growing fastest.
Conclusion
Website traffic analysis in 2026 is not fundamentally harder than it was five years ago. Most of the core questions are the same: where are visitors coming from, which pages drive value, what’s causing fluctuations.
What’s changed is the surface area. AI platforms are now a primary discovery channel for high-intent audiences, and they operate almost entirely outside the visibility of traditional analytics infrastructure. GA4 and GSC remain essential. They just don’t cover everything anymore.
The teams that will pull ahead are the ones that treat the GA4 “Direct” bucket with appropriate skepticism, build UTM discipline across every controlled channel, and invest in measurement tools that can reach into the AI conversation layer where purchase decisions are increasingly forming.
Traffic you can’t see is traffic you can’t optimize.
FAQ
How to measure website traffic growth over time?
Use both MoM (month-over-month) and YoY (year-over-year) comparisons in GA4 to control for seasonality. GA4’s Explore feature lets you build cohorts based on first-touch acquisition, which is useful for understanding the long-term value of users acquired in specific time periods rather than just looking at aggregate session counts.
How to analyze website traffic for free?
GA4 and Google Search Console cover the fundamentals at no cost. GA4 tracks what users do on your site; GSC tracks how they find it through organic search. For small businesses needing competitive context, Ubersuggest’s free tier or SimilarWeb’s browser extension provides a useful starting point. To track AI-platform traffic, you’ll need a dedicated tool, since neither GA4 nor GSC surfaces LLM referrals reliably.
How to track website traffic sources?
GA4’s Traffic Acquisition report maps sessions to default channel groupings using referrer headers. For any traffic source you control, add UTM parameters to every outbound link. For AI-native traffic, implement custom regex filters in GA4 Admin settings to catch identifiable referrals from domains like chatgpt.com or perplexity.ai, and treat unexplained “Direct” uplift as a proxy for AI influence you can’t yet attribute directly.
How do I use website traffic analysis for SEO optimization?
Correlate GSC impression data with GA4 engagement data at the page level. High impressions with low CTR typically points to a metadata problem. High CTR with high bounce rate usually means content-to-intent mismatch. In 2026, add an AI Overviews check: if a query triggers an AI Overview in GSC, the traffic potential from ranking alone is significantly lower, and optimizing for that query may mean targeting the AI citation rather than the click.
How to analyze competitor website traffic?
SimilarWeb provides panel-based traffic estimates for competitor domains, including referral source breakdowns and audience demographics. Semrush’s Traffic Analytics feature offers keyword-level data and visibility trends. Neither tool gives direct access to a competitor’s GA4 data, so treat estimates as directional signals for benchmarking rather than precise counts.

