Most teams don’t have a visibility problem. They have a measurement problem.
You’ve restructured your content, tightened your brand narrative, and started optimizing for AI-generated answers. But can you prove it’s working? More importantly, can you show how much it’s working compared to last month, and compared to your top competitor?
That’s where most AEO efforts stall. The optimization is real, but the reporting framework is borrowed from SEO — and the metrics simply don’t translate.
This guide gives you a practical KPI framework built for AI search: what to track, how to read the numbers, and how to build a monthly report that your leadership team will actually act on.
Why Your SEO Dashboard Is Lying About AEO Results
Traditional SEO is built on a retrieval model. A search engine indexes URLs, ranks them by authority, and distributes clicks. Your dashboard reflects that: traffic, rankings, CTR, bounce rate.
AEO works differently. An answer engine doesn’t rank links — it selects sources, synthesizes them, and constructs a response. Your brand might appear prominently in that response without generating a single click. That’s not a failure. That’s called a zero-click brand impression, and in high-intent AI conversations, it carries real influence.
The measurement gap is structural. Click-through rate becomes nearly meaningless when the answer is delivered inside the AI interface. Keyword ranking doesn’t tell you whether ChatGPT treats your brand as a trusted source or a footnote. And organic traffic from Google doesn’t capture the user who asked Perplexity “what’s the best CRM for small teams” and got your brand recommended as option one.
The shift is from traffic-oriented metrics to trust and influence-oriented metrics.
The 5 Core AEO KPIs You Should Be Tracking
These five metrics form the foundation of any serious AEO measurement framework. Together, they cover visibility, narrative quality, competitive positioning, content authority, and conversion potential.
1. AI Visibility Score
This is the baseline metric: how often does your brand appear in AI-generated answers across a defined set of prompts?
The calculation is straightforward. Take your standardized prompt library, run it across your target AI platforms, and divide the number of responses that mention your brand by the total prompts tested.
$$\text{AI Visibility Score} = \left( \frac{\text{Responses mentioning your brand}}{\text{Total prompts tested}} \right) \times 100$$
A visibility score of 30% means your brand appears in 3 out of every 10 AI responses tested. For market leaders in competitive verticals, the target range sits between 35% and 45%. Emerging challengers typically start between 5% and 15%, with early gains concentrated in long-tail, high-specificity prompts.
Topify’s Visibility Tracking automates this across ChatGPT, Gemini, Perplexity, and other major platforms, running standardized prompt sets continuously so you’re comparing apples to apples over time.
2. Sentiment Score
Being mentioned isn’t enough if AI is describing your brand as “expensive,” “complex,” or “hard to implement.” Sentiment Score quantifies the tone of those mentions on a 0–100 scale.
Research shows that 80% is the meaningful threshold. When more than 80% of your AI mentions carry positive framing, models are significantly more likely to recommend your brand directly in response to subjective queries like “what’s the best tool for X?” Drop below 60%, and you’re likely dealing with negative associations baked into AI training data — potentially from critical reviews, competitor content, or outdated product narratives.
AI models inherit the “narrative bias” present in their training sources. If authoritative third-party content consistently describes your brand as reliable, technically strong, or well-supported, that framing shows up in AI answers. The implication: Sentiment Score is as much a content strategy signal as it is a reporting metric.
3. Response Position Index (RPI)
In list-style AI recommendations, position matters. When a user asks “what are the top project management tools for remote teams,” the brand named first gets a fundamentally different level of trust than the brand mentioned fifth.
The Response Position Index assigns weighted scores based on where your brand appears:
| Position | Score | Strategic Meaning |
|---|---|---|
| First mention | 10 | Default industry leader, highest trust signal |
| Top 3 | 7 | Core competitive set, high selection probability |
| Mid/late mention | 4 | Known alternative, not the primary recommendation |
| Not mentioned | 0 | Invisible on this topic |
Tracking RPI over time reveals something visibility scores alone can’t: whether AI is increasing or decreasing its trust weighting for your brand, even when raw mention counts stay flat.
4. Source Citation Rate
This metric tracks how often AI platforms include a link back to your domain when citing your content. Platforms like Perplexity and Gemini are built around verifiability — citations are their primary mechanism for driving referral traffic.
$$\text{Citation Rate} = \left( \frac{\text{Responses citing your domain}}{\text{Total responses with external citations}} \right) \times 100$$
High visibility + low citation rate is a specific diagnostic signal. It typically means AI is drawing on your brand’s knowledge — your definitions, frameworks, data — without attributing it. That’s often a structured data problem. Adding JSON-LD schema markup and improving content crawlability can close the gap.
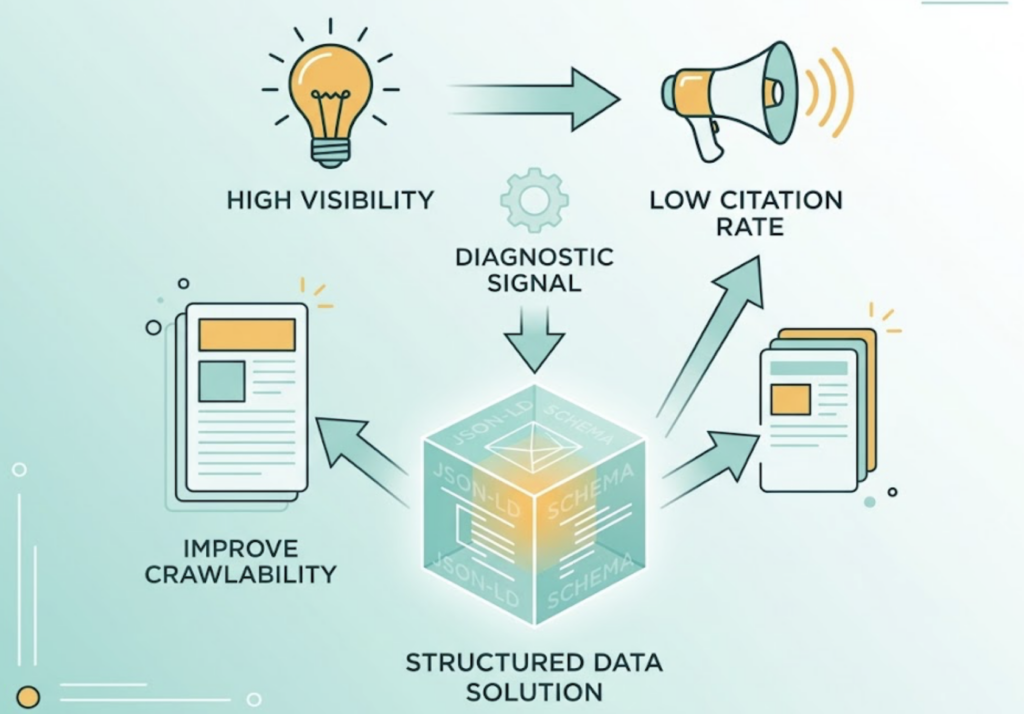
High citation rate, on the other hand, means AI isn’t just mentioning you — it’s treating your content as ground truth.
5. Conversion Visibility Rate (CVR)
CVR is the forward-looking metric: how often does your brand appear in AI responses to high-commercial-intent prompts? Queries like “compare X and Y for enterprise security” or “what tool should I use for [specific workflow]” signal users who are close to a decision.
Here’s the bottom line on why this matters: visitors who arrive via AI citation links convert at roughly 4x the rate of traditional organic search traffic. These users have already received a brand recommendation inside the AI interface. By the time they click through, they’re pre-qualified.
CVR is measured by focusing your prompt set on commercial-intent queries and tracking your brand’s appearance rate in that subset, combined with referral traffic data from your analytics platform.
Topify’s CVR tracking connects AI appearance data directly to downstream conversion signals, giving teams a cleaner picture of AEO’s revenue contribution.
What “Good” Looks Like: Benchmarks and Baselines
Setting realistic performance targets requires understanding where your brand sits relative to the market.
| Market Position | Target AI Visibility Range | Share of Voice Goal |
|---|---|---|
| Market leader | 35% – 45% | 40%+ in core vertical |
| Established brand | 15% – 30% | 25%+ to prevent share erosion |
| Emerging challenger | 5% – 15% | Target long-tail intent gaps |
For Sentiment Score, 80% positive framing is the goal. Below 60%, treat it as a content and PR alert — not a cosmetic problem.
These aren’t fixed standards. AI search is still evolving rapidly, and benchmarks shift as model versions update and new platforms gain traction. That’s why you need a baseline specific to your brand before benchmarks from industry averages mean anything.
The 30-Day Baseline Method
First-time AEO measurement programs should start with a structured 30-day baseline sprint:
- Build your prompt library. Select 100–200 prompts that span your buyer journey, from awareness-stage questions to high-intent comparison queries.
- Run multi-platform sampling. Test across ChatGPT, Gemini, Claude, and Perplexity. For brands targeting specific markets, add DeepSeek or Doubao.
- Calculate a rolling average. AI outputs have inherent randomness. A single snapshot isn’t meaningful. The 30-day moving average is your actual baseline.
Only once you have that baseline can you say with confidence whether a change in your content strategy moved the needle.
How to Build a Monthly AEO Report
A monthly AEO report should do one thing: turn measurement data into decisions. Here’s a four-module structure that works.
Module 1: Executive Summary with Visibility Radar Chart
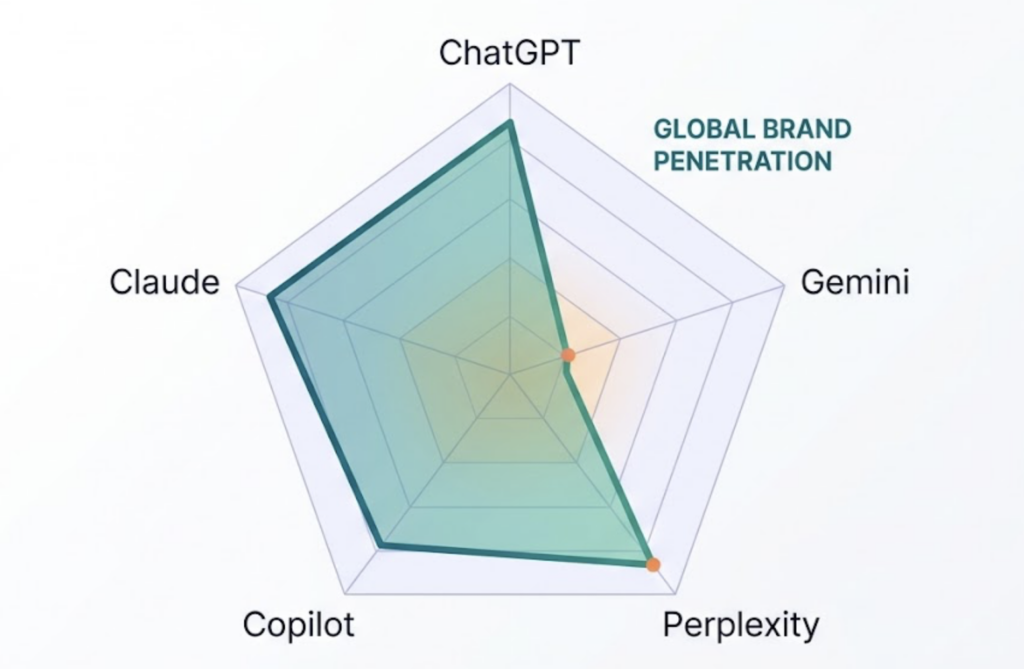
Open with a radar chart where each axis represents a platform (ChatGPT, Perplexity, Gemini, etc.). The area covered by the polygon shows your brand’s overall AI ecosystem penetration. A collapse on any single axis — say, near-zero visibility on Gemini — immediately flags a platform-specific problem that deserves investigation.
Module 2: KPI Dashboard
This section tracks month-over-month movement across all five core metrics. The ratio of mentions to citations is particularly telling: if mentions climb but citations stay flat, your content is being used but not credited — a signal to prioritize structured data improvements.
Topify’s dashboard exports these metrics in standardized formats, reducing the time between pulling data and building the report.
Module 3: Competitor Gap Heatmap
A topic-by-competitor heatmap is where the real strategic value lives. Hot spots show where your brand has clear narrative ownership. Cold spots — topics where competitors dominate and your brand is largely absent — define your content production roadmap for the following month.
Don’t skip this module. Brands that only report their own metrics miss half the picture.
Module 4: Action Items
Every data point should connect to a specific optimization task. Citation rate low? Assign JSON-LD schema deployment. Visibility flat on Perplexity? Audit which content types that platform indexes and prioritize accordingly. The report’s value is measured by what it causes people to do, not by how many charts it contains.
The Prompts You Should Be Monitoring
In AEO, prompts are the new keywords. But unlike keywords, not all prompts have equal commercial value.
Topify’s AI Volume Analytics surfaces prompt frequency data across AI platforms — distinct from traditional Google search volume. Some queries with modest Google traffic turn out to be high-frequency AI conversation topics, especially complex advisory questions like “how do I evaluate X vs Y for a team of 50.”
Four filters for high-value prompt selection:
Commercial intent. Prompts containing “compare,” “best,” “how to choose,” or “vs” signal purchase-proximity. These get prioritized.
Query fanout ability. AI engines decompose complex questions into sub-queries. Prompts that trigger sub-queries around your core strengths are high-leverage tracking targets.
Coverage. Choose prompts with consistent natural language patterns across different user demographics, not hyper-specific phrasing that only one type of user would use.
Conversion potential. Weight prompts based on historical conversion data from topics you already track.
How many prompts to track?
| Team Size | Recommended Prompt Library |
|---|---|
| Startup / small brand | 20–30 core commercial-intent prompts |
| Mid-size / multi-product | 50–200 across buyer journey stages |
| Agency / enterprise | 500–1,000 for full competitive monitoring |
Start with your core set and expand as your reporting cadence matures.
3 Reporting Mistakes That Distort Your AEO Strategy
Getting data is one thing. Reading it correctly is another.
Mistake 1: Reporting your visibility without competitor context
Your AI Visibility Score went up 8 points last month. Good news, right? Not necessarily. If your top competitor’s visibility grew 15 points in the same period, your share of AI voice actually contracted. Reporting absolute numbers without a competitive baseline creates false confidence.
Every AEO report needs a benchmark column: where you stand relative to the brands competing for the same AI recommendations.
Mistake 2: Using website traffic to validate AEO performance
Some teams try to infer AEO results from Google Search Console traffic. That’s the wrong tool for the job.
AEO’s primary value often lives upstream of the click. A high-intent user who gets your brand recommended in a ChatGPT response may not click through immediately — but they’ve received a brand endorsement from a source they trust more than a search result link. Pre-influence is real and valuable even when it doesn’t show up as a session in GA4.
Over-indexing on click data causes teams to abandon AI visibility efforts that are actually working, simply because the measurement framework can’t see them.
Mistake 3: Running quarterly reports instead of monthly ones
AI model updates — new ChatGPT versions, Gemini index changes, Perplexity ranking adjustments — happen on a rolling basis throughout the year. A quarterly reporting cadence means you might not catch a competitive shift until three months after it happened.
Monthly deep-dive reports are the minimum standard. For competitive SaaS and e-commerce categories, add a weekly anomaly monitor that flags significant movement in your top 20 prompts. Catching a competitor’s surge early gives you a content response window that quarterly reporting simply can’t provide.
Conclusion
Measuring AEO performance is really about quantifying algorithmic trust. Visibility tells you whether AI sees your brand. Sentiment tells you how AI describes it. Citation rate tells you whether AI treats your content as a reliable source. Position tells you whether AI is recommending you over your competitors. CVR tells you whether that recommendation translates into business value.
None of those questions can be answered with a traffic dashboard.
The brands that build rigorous AEO measurement practices now will have something more valuable than a reporting system — they’ll have an optimization feedback loop. Every month’s data defines the next month’s content priorities. Every prompt gap is a territory worth claiming before a competitor does.
That’s how AEO moves from an experiment to a measurable growth channel.
FAQ
How often should I pull AEO performance reports?
Monthly deep-dive reports for strategic decisions, combined with weekly automated dashboards for anomaly detection. Weekly monitoring is particularly important in fast-moving categories where competitors can shift the narrative quickly.
Can I measure AEO performance without a dedicated tool?
You can manually test a small sample — 10 to 15 prompts across a few platforms — but the outputs have significant randomness. A single test on a single day isn’t statistically meaningful. Without automated, multi-platform, longitudinal sampling, you’re looking at anecdotes rather than data. Manual testing also doesn’t scale to the prompt volumes needed for competitive monitoring.
What’s the difference between AEO KPIs and GEO KPIs?
AEO focuses on outcome-layer optimization: ensuring your brand appears in specific AI search features like AI Overviews and citation links. GEO focuses on the system layer: strengthening entity associations and narrative consistency so AI models are more likely to synthesize your brand into generated responses. In practice, the KPI frameworks overlap significantly, with AEO metrics tending to be more feature-specific and GEO metrics more holistic.
How many AI platforms should I monitor for accurate data?
At minimum: ChatGPT, Gemini, Claude, and Perplexity. These four cover the majority of AI search activity in most markets. For brands targeting Asia-Pacific or Chinese-speaking markets, add DeepSeek and Doubao.

