Most marketing teams don’t have a data problem. They have a diagnosis problem.
The dashboards are green. The reports go out every Monday. And somehow, at the end of the quarter, the numbers still don’t add up. You know what happened — traffic dropped, leads slowed, ROAS slid. What you don’t know is why.
That gap between “what happened” and “why it happened” is where campaigns die quietly. And it’s exactly what most marketing analytics tools are still failing to close.
This article ranks eight tools not by feature count or pricing tiers, but by one question: can this tool actually tell you why a campaign failed?
You Probably Have Too Much Data and Too Few Answers
The “Big Data” era gave marketing teams more dashboards than decisions. The average enterprise marketing stack now includes 12-plus tools, each generating its own reports — and most of those reports describe the past without explaining it.
This is the diagnostic gap. Data confirms a conversion rate dropped. It rarely explains whether the drop came from a creative fatigue issue, a targeting misalignment, a UX problem on the landing page, or a competitor gaining ground in AI-generated recommendations.
The result is what analysts call data fatigue: teams spending 60-70% of their time preparing data rather than acting on it. That’s not a tools problem. That’s a framework problem.
Reporting vs. Diagnostics: A Real Difference
A reporting tool answers “what happened.” A diagnostic tool answers “why.” The difference matters more than most buyers realize before signing a contract.
Reporting is built for visibility and stakeholder alignment. It pulls data from your CRM, ad platforms, and web logs, then displays it in a consistent format. It tells you that bounce rate increased 18% last Tuesday. It does not tell you whether that increase came from a broken mobile form, a mismatched ad headline, or a shift in audience quality.
Diagnostic analytics goes deeper. It uses drill-downs, cohort segmentation, and anomaly detection to isolate the root cause. That’s not a minor upgrade — it’s a fundamentally different tool category.
| Feature | Reporting Tools | Diagnostic Analytics Tools |
|---|---|---|
| Primary question | What happened? | Why did it happen? |
| Data nature | Summarized, historical | Granular, segmented, exploratory |
| User interaction | Passive viewing | Active interrogation of variables |
| Outcome | Accountability | Root cause identification |
| Complexity | Low to moderate | High; often requires technical expertise |
The platforms that make this list earned their spot by leaning diagnostic, not just descriptive.
5 Metrics That Actually Predict Campaign Failure Before It Happens
Conversion rate is a lagging indicator. By the time it drops, the budget has already been wasted. Proactive diagnostics require metrics that signal trouble during the campaign, not after.
Here are five that actually matter.
1. CTR trend, not just CTR. A slow decline in click-through rate while impressions hold steady is a classic sign of creative fatigue. Ad platforms respond by lowering relevance scores, which raises CPC and degrades traffic quality — all before conversions show any movement.
2. CPL vs. pipeline quality. Cost Per Lead staying flat can mask a real failure if the leads coming in are lower quality than before. The metric to watch isn’t CPL in isolation — it’s CPL in the context of downstream conversion rates.
3. Sales cycle length. An unintended extension in the average sales cycle is a mid-funnel diagnostic signal. It typically points to friction in the nurturing process or a mismatch between what the ad promised and what the landing page delivered.
4. Anomaly Z-scores. Automated anomaly detection uses machine learning to flag deviations from baseline performance — accounting for seasonality and day-of-week patterns. A Z-score above 2.5 signals an urgent investigation. Above 3.0, something has broken.
5. AI Answer Share. This one doesn’t show up in traditional marketing analytics tools at all. As platforms like ChatGPT and Perplexity become primary research channels, whether your brand appears in AI-generated recommendations is increasingly a leading indicator of organic demand — and most teams are flying blind on this metric.
Why Conversion Rate Alone Tells You Nothing About What Went Wrong
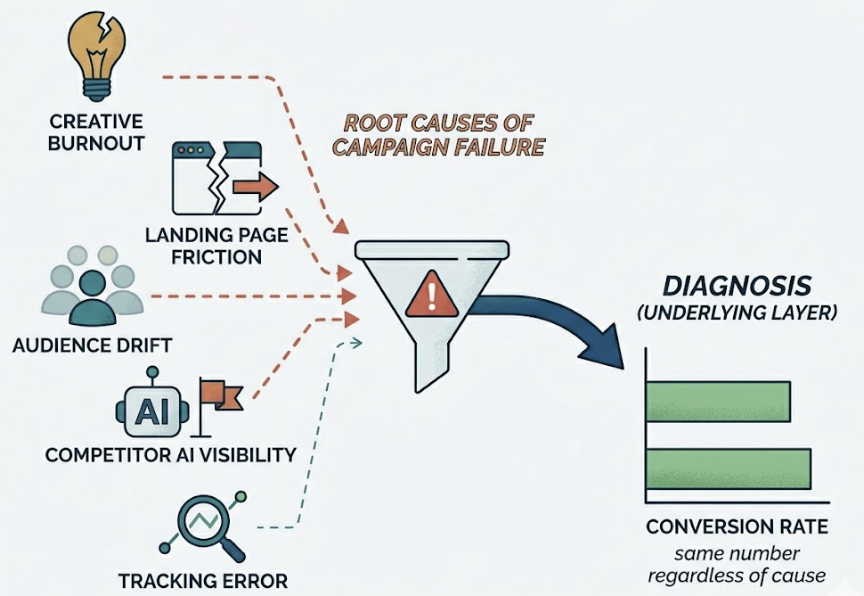
Conversion rate is the most-watched metric in marketing and one of the least useful for diagnosis. It confirms failure. It doesn’t explain it.
A campaign can fail from creative burnout, landing page friction, audience drift, a competitor gaining AI visibility, or a simple tracking error. Conversion rate registers the same number regardless of cause. Without the layer beneath it, you’re treating symptoms with no diagnosis.
The tools below are ranked specifically on how well they provide that layer.
The 8 Marketing Analytics Tools, Ranked by What They Can Actually Diagnose
These aren’t just the most popular platforms. They’re the ones that can give you a defensible answer when someone asks why the campaign underperformed.
1. Topify — Diagnostic Layer for AI Search Visibility
Topify occupies a category most marketing analytics tools haven’t touched yet: AI search diagnostics. While every tool on this list tracks what happens on your website, Topify tracks what happens before users ever get there — specifically, whether your brand is showing up in ChatGPT, Gemini, and Perplexity responses.
That’s not a niche use case anymore. AI-referred visitors convert at 14.2%, compared to 2.8% for Google organic — a 5x advantage. In B2B categories, Perplexity traffic has shown conversion rates as high as 20-30%. The brands not tracking AI visibility are missing the highest-intent traffic channel in the current environment.
Topify’s core diagnostic capability is what it calls Answer Share: the percentage of AI-generated responses that mention your brand versus your competitors. It tracks brand mentions across seven key metrics — visibility, sentiment, position, volume, mentions, intent, and CVR — with daily refreshes. Its Source Analysis feature reverse-engineers which domains AI platforms are citing, so you can identify exactly where your authority gaps are before they become traffic gaps.
It also surfaces “near-top 3” keyword opportunities in organic search, giving teams a prioritized list of quick-win content updates alongside the AI visibility data.
Best for: Marketing teams, brand managers, and agencies that want to diagnose why organic performance is declining — especially in categories where AI Overviews and chatbot recommendations are eating into traditional search traffic.
Limitations: Focused on organic and AI search visibility; doesn’t replace paid media attribution or CRM-level revenue mapping.
Starting price: Free tier available; paid plans from $99/month.
2. Northbeam — Incrementality-Focused Attribution for High-Volume DTC
Northbeam is built for brands that have outgrown platform-reported metrics and need a statistically honest single source of truth. Its core value is fractional attribution: rather than giving 100% credit to the last click, it distributes credit across the customer journey using machine learning — and it guarantees that attributed sales never exceed actual order counts.
The incrementality testing is where it earns its diagnostic credentials. It isolates which ad dollars are actually driving new revenue versus capturing demand that would have converted anyway. For brands running complex multi-channel mixes — TV, podcasts, influencer — that distinction is worth significant budget reallocation.
Best for: Growth-stage DTC brands ($40M+ revenue) running mature, multi-channel campaigns where platform-reported ROAS is no longer trustworthy.
Limitations: Steep learning curve; typically requires dedicated analytics resources. Starting around $1,000/month.
3. Triple Whale — Daily Operating System for Shopify Brands
Triple Whale has become the default attribution layer for Shopify merchants who need clear daily profitability data without a data science team. Its Triple Pixel collects first-party behavioral data, bypassing iOS privacy restrictions that have made platform-reported metrics increasingly unreliable.
Its diagnostic strength is the blended Marketing Efficiency Ratio (MER) — a more honest view of total marketing performance than channel-specific ROAS. It also integrates inventory data, flagging when ads are running for products that are low on stock, which is a common and expensive campaign failure point.
Best for: Shopify-native brands ($10M-$40M revenue) needing fast, actionable daily clarity.
Limitations: Limited to the Shopify ecosystem. Starting around $129/month.
4. Funnel.io — Data Infrastructure for Enterprise Complexity
Funnel.io solves a different problem than the other tools here: it normalizes fragmented data from 600-plus connectors into a stable foundation for advanced analytics. It doesn’t do the diagnostics itself — it ensures the data feeding your diagnostics is clean, consistent, and historically archived.
For enterprises running Marketing Mix Modeling or cross-platform incrementality testing, reliable data infrastructure is the prerequisite. Funnel.io’s Data Hub handles API changes and schema updates automatically, which removes a significant ongoing maintenance burden from analytics teams.
Best for: Large agencies and multi-brand enterprises where data fragmentation is the primary diagnostic blocker.
Limitations: Functions as a data layer, not a recommendation engine. Pricing varies by data volume.
5. Mixpanel — Behavioral Diagnostics for Product-Led Teams
Mixpanel focuses on what happens after the click — making it indispensable for SaaS and product-led growth teams that need to diagnose user drop-off, feature adoption, and long-term retention. Its unlimited funnel steps and deep retention cohorts allow teams to map every interaction from first touch to loyal customer.
The diagnostic value isn’t in acquisition analytics. It’s in answering why users engage (or don’t) at every stage of the product experience. If campaigns are delivering qualified leads but retention is collapsing, Mixpanel finds where the experience breaks down.
Best for: SaaS teams and product-led growth organizations.
Limitations: No native session recordings or heatmaps. Not designed for cross-channel acquisition attribution.
6. Heap — Retroactive Behavioral Analysis
Heap’s defining feature is automatic event capture: it records every user interaction from day one, without requiring manual tracking setup. That means teams can build funnels and cohorts retroactively — analyzing events they didn’t know they’d need to track when they deployed the tool.
For teams that have lost diagnostic context because they didn’t set up event tracking correctly early on, Heap offers a way back. It’s genuinely useful for post-hoc investigation of UX failures and conversion drop-off points.
Best for: Teams with significant budgets who prioritize ease of retroactive setup.
Limitations: Opaque enterprise pricing (estimates range from $2,000-$5,000+/month); data retention limits on lower-tier plans can constrain long-term trend analysis.
7. Google Analytics 4 — The Baseline Everyone Uses
GA4 remains the foundational diagnostic layer for most of the internet, primarily because it’s free and deeply integrated with the Google ad ecosystem. For small to mid-sized businesses, it answers the core questions: where is traffic coming from, what’s converting, and what’s not.
The data-driven attribution models are a genuine upgrade from the old Universal Analytics last-click defaults. For teams operating within the Google ecosystem, they’re worth configuring properly.
Best for: Small to mid-sized teams with limited budgets that need solid acquisition diagnostics without enterprise overhead.
Limitations: Data retention limited to 14 months on the free tier; heavy data sampling in large datasets reduces diagnostic precision; limited for behavioral product analysis.
8. Supermetrics — Automation for BI-Centric Teams
Supermetrics has evolved from a data connector into what it calls a “Marketing Intelligence Cloud.” Its core value is moving marketing data from ad platforms and analytics tools into the BI environments teams already use — Looker Studio, Power BI, Excel, Google Sheets.
Its newer AI-powered “Insights Agent” can answer plain-language questions like “Why are leads down this week?” — a genuine diagnostic upgrade over raw data pipelines. The Conversion Sync feature feeds enriched data back to ad platforms to improve algorithmic targeting.
Best for: Teams heavily invested in Google or Microsoft BI ecosystems who need to centralize and activate data at scale.
Limitations: Best results depend on external visualization tools; costs can escalate as connectors and storage modules are added.
Quick Comparison
| Tool | Core Diagnostic Strength | Starting Price | Best For |
|---|---|---|---|
| Topify | AI search visibility + Answer Share | Free / $99/mo | Organic + AI channel diagnostics |
| Northbeam | Fractional attribution + incrementality | ~$1,000/mo | High-volume DTC brands |
| Triple Whale | Blended MER + first-party pixel | ~$129/mo | Shopify brands |
| Funnel.io | Data normalization + pipeline stability | Volume-based | Enterprise data infrastructure |
| Mixpanel | Behavioral funnels + retention cohorts | Free / usage-based | SaaS + product-led growth |
| Heap | Retroactive event capture | ~$2,000+/mo | Teams needing retroactive setup |
| GA4 | Acquisition diagnostics + Google attribution | Free | Small to mid-sized teams |
| Supermetrics | BI pipeline automation + AI query | Usage-based | Google/Microsoft BI environments |
What to Look for Beyond the Demo: 3 Questions to Ask Every Vendor
Vendor demos are designed to surface strengths and obscure gaps. Before signing, ask three questions that cut through the presentation.
1. What specific process does this replace? If the answer is vague, the tool will go unused. It should replace something concrete — a shared spreadsheet, a manual reporting process, a channel attribution gap. No clear replacement, no clear ROI.
2. What data does it require upstream, and what does it produce downstream? A diagnostic tool is only as good as the data feeding it. If it requires clean CRM data and your data quality is poor, the outputs will mislead rather than inform.
3. What complexity does it remove, and what complexity does it add? Every tool introduces a hidden administrative load. The net reduction in complexity has to justify the investment — including training, integration maintenance, and the ongoing opportunity cost of managing the tool.
AI-Native Analytics vs. Legacy Dashboards — What the Gap Actually Costs
Traditional marketing analytics tools were built for a session-based web. A user lands on a page. A cookie fires. Attribution logic assigns credit. That model is breaking down.
AI-powered answer engines like ChatGPT, Gemini, and Perplexity are increasingly the first point of contact between a potential buyer and a brand. According to Similarweb, searches that trigger AI Overviews have an 83% zero-click rate. No session fires. No referral header is passed. The discovery happens in an environment traditional analytics tools are architecturally blind to.
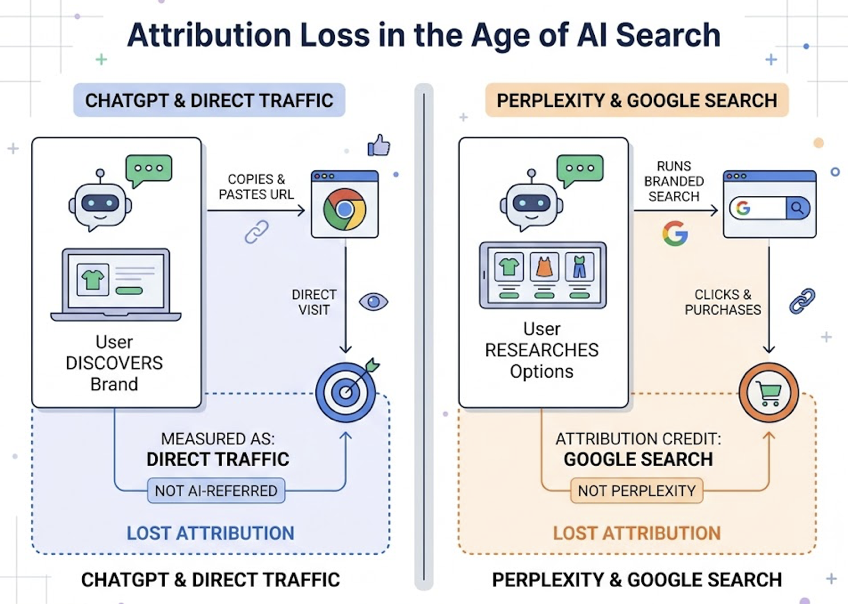
The Attribution Black Hole Most Marketing Stacks Still Can’t See
When a user discovers a brand in ChatGPT, the most common behavior is copying the URL and pasting it into a browser. That registers as direct traffic — not AI-referred. When a user researches options in Perplexity and then runs a branded Google search to purchase, the branded search gets the attribution credit. The AI engine that created the demand gets nothing.
This isn’t a minor measurement gap. AI-referred visitors spend 68% more time on site than typical organic visitors. ChatGPT sessions average close to 10 minutes; Claude sessions can reach 19 minutes, compared to the standard 5-minute organic session. ChatGPT accounts for 77-87% of identifiable AI referral sessions, with Perplexity representing 12-15%.
The brands not measuring this channel are systematically under-investing in the content and citations that drive it.
Topify addresses this by monitoring brand inclusion upstream of the website visit — tracking how often a brand is mentioned in AI-generated answers and what sources those AI engines are citing. For teams running content or SEO programs, this shifts the optimization question from “how do I rank for keywords?” to “how do I build authority consensus across the sources AI engines trust?” That means Reddit threads, YouTube reviews, industry publications, and G2 listings — the distributed signals that AI platforms use to decide who to recommend.
How Agencies Track 10+ Clients Without Drowning in Dashboards
Agencies managing 10-plus clients face an exponential version of the same data problem in-house teams face. Without structured diagnostic workflows, account managers spend most of their billable hours on data wrangling — a task that adds zero strategic value to clients.
The fix isn’t more dashboards. It’s a role-specific view architecture.
Executive portfolio view: Aggregated metrics across the entire client roster — total spend, blended ROAS, and account health scores — allowing owners to run a quick pulse check without logging into individual accounts.
Manager performance view: Channel breakdowns and week-over-week efficiency metrics for specific clients.
Specialist optimization view: Granular data for daily tuning — ad set performance, keyword rankings, A/B test results.
Standardized naming taxonomies also matter more than most agencies realize. Agencies that enforce consistent campaign naming conventions can reduce dashboard build time by over 80%, since automated tools can categorize data without human intervention. The same principle applies to data validation: automating alerts when data is more than 24 hours old or when a metric deviates more than 30% from historical range catches errors before they become client conversations.
For agencies managing multiple brands’ AI visibility, Topify’s multi-project architecture covers the gap that traditional SEO and attribution tools leave entirely uncovered. A single account can track competitor positioning, sentiment shifts, and AI citation sources across multiple client brands simultaneously — turning what is currently a manual research task into a structured, reportable workflow.
Before You Buy: What Vendors Won’t Tell You in the Demo
The annual license fee is typically the smallest component of what a marketing analytics tool actually costs. Organizations that don’t account for the fully loaded cost often hit what analysts call the 2.5x multiplier — hidden expenses that exceed the visible software budget.
Integration costs are real. Native connectors typically cover only 60% of enterprise requirements. The remaining 40% requires custom development or middleware. Custom integration can run $5,000-$25,000 per platform, with ongoing maintenance costing 15-20% of that initial investment annually.
Skill gaps are expensive. Sophisticated diagnostic platforms require specialized internal expertise. When that expertise lives in one or two people, it creates a single point of failure if they leave.
Vendor lock-in compounds at renewal. Initial contracts often include significant discounts. By renewal, switching costs are high and negotiating leverage is low — unless price cap clauses and exit conditions were explicitly included in the original agreement.
Opportunity cost is the most ignored cost. Teams fighting their tools aren’t running campaigns. Every hour spent on data wrangling is an hour not spent on strategy. That’s not a line item on any invoice, but it’s often the largest number in the total cost calculation.
Conclusion
The tool you choose for marketing analytics is only as useful as the question it’s built to answer. Most platforms answer “what happened.” Fewer answer “why.” And almost none, until recently, have answered what’s happening in the AI search environments where high-intent discovery is increasingly taking place.
The diagnostic gap is real, and it’s widening. Picking the right tool isn’t about features or price — it’s about matching the tool to the specific question your team needs answered. For teams losing organic ground to AI Overviews, that question is about visibility before the click. For DTC brands with complex media mixes, it’s about incrementality. For product-led SaaS companies, it’s about behavioral drop-off.
Start with the question. Then find the tool that answers it.
FAQ
What’s the difference between marketing analytics tools and BI tools?
BI tools like Tableau or Power BI are built for enterprise-wide data visualization and historical reporting. They focus on “what happened.” Marketing analytics tools are specialized for acquisition diagnostics, attribution modeling, and campaign optimization — they include marketing-specific logic like customer journey mapping and cross-channel deduplication that generic BI tools don’t have natively.
Can small businesses afford enterprise diagnostic tools?
Enterprise platforms like Northbeam or Heap have high entry prices in the $1,000-$2,000+/month range, but the market has become more accessible. Triple Whale starts around $129/month for Shopify brands. Topify offers a free entry point with paid plans from $99/month. Small businesses should prioritize tools with predictable, usage-based pricing to avoid the “contact us” pricing trap common with legacy platforms.
Do I need a separate tool for AI search analytics?
Yes — if AI-influenced channels are relevant to your category, which increasingly means most B2B and high-consideration B2C markets. Traditional analytics tools are built for session-based web tracking. They’re architecturally blind to Answer Share and citations in chat-based AI environments. Specialized platforms like Topify monitor inclusion rates and citation gaps before they translate into measurable traffic declines.
How often should I review my marketing analytics stack?
A formal MarTech audit every six months is a reasonable baseline. A strategic reassessment of the full “operating system” annually. The audit should specifically identify “zombie tools” — those being paid for but underutilized — and flag gaps in coverage that have opened up as the search and attribution landscape has shifted. AI search diagnostics is currently the most common gap.

