Harness wasn’t the first CI/CD tool. It didn’t invent the pipeline. But the numbers around it in 2025 tell a story that’s hard to ignore: a $5.5 billion valuation, 128 million deployments in a single year, and a growing list of enterprise engineering teams that have quietly consolidated their entire delivery stack onto one platform.
If you’re evaluating Harness, building a case for your team, or just trying to understand where the DevOps market is heading, these 20 stats give you an unfiltered picture.
Harness by the Numbers: Platform Operating Scale
The easiest way to assess a platform is to look at what it’s actually processing. Not feature lists. Not marketing claims. Volume.
Stat 1: 128 million deployments in the trailing 12 months. That’s not a total since founding. That’s one year. It reflects the scale of enterprises that have moved their entire deployment layer onto Harness, not just piloting it.
Stat 2: 81 million builds in the same period. Build volume is a proxy for developer activity. 81 million builds means a continuous, high-frequency engineering motion, not sporadic usage.
Stat 3: 1.2 trillion API calls protected. The security layer of the Harness platform has processed over 1.2 trillion API calls. For context, that’s the kind of throughput that makes automated secret scanning and dependency testing non-negotiable, not nice-to-have.
Stat 4: $1.9 billion in cloud spend managed through Harness FinOps. Cloud cost management has moved from the CFO’s spreadsheet to the developer’s dashboard. That $1.9 billion figure represents real infrastructure spend that Harness teams are actively tracking, rightsizing, and optimizing in real time.
Harness Engineering’s Financial Momentum
A platform’s financial health matters because it determines how fast the product roadmap moves and how long enterprise contracts actually get honored.
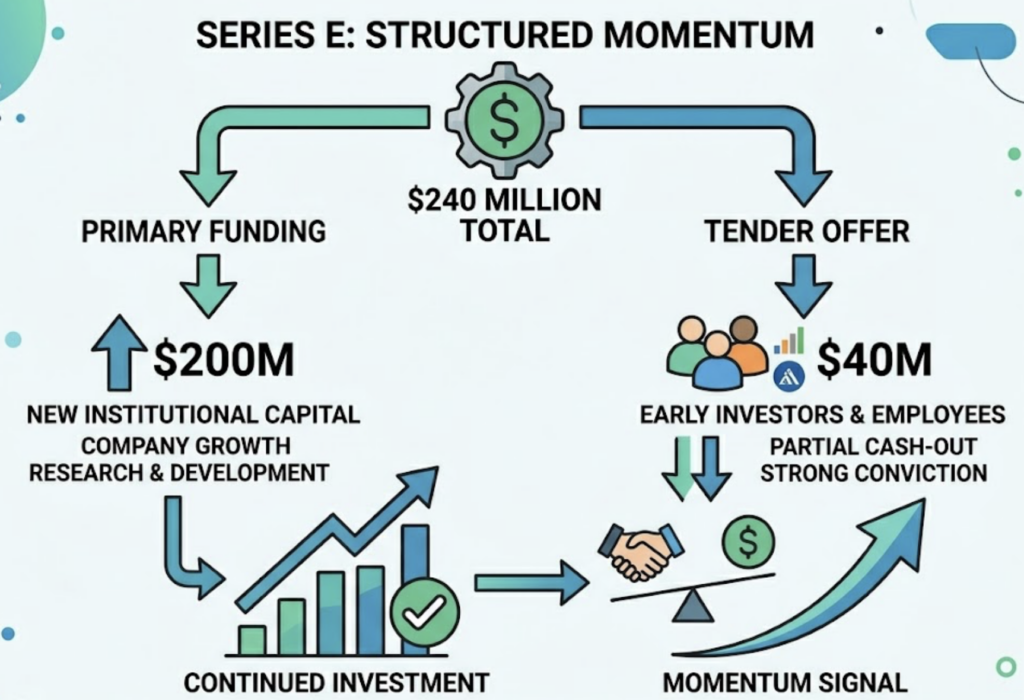
Stat 5: $5.5 billion valuation as of late 2025. Harness closed a $240 million Series E led by Goldman Sachs Asset Management, including IVP, Menlo Ventures, and Unusual Ventures. The $5.5B valuation places it firmly in the upper tier of enterprise DevOps companies, despite a tight venture market.
Stat 6: $240 million Series E, split $200M primary + $40M tender offer. The tender offer component matters. It signals that early investors and employees had enough conviction to partially cash out, while new institutional capital was simultaneously flowing in. That’s not a desperate raise. That’s structured momentum.
Stat 7: Annual Recurring Revenue on track to exceed $250 million in 2025. ARR is the most honest financial metric for a SaaS company. Exceeding $250M puts Harness in a category where enterprise renewals, not new logo chasing, become the primary growth engine.
Stat 8: 50%+ year-over-year growth rate. Sustained 50% YoY growth at this ARR scale is genuinely hard to maintain. It means Harness isn’t just landing new accounts. It’s expanding within existing ones, which is typically a sign of real workflow dependency rather than experimental adoption.
The AI Velocity Paradox: The Problem Harness Was Built to Fix
Here’s the thing most dev tool vendors won’t say out loud: AI is making individual developers faster, but it’s making many engineering organizations slower overall. The data on this is stark.
Stat 9: 63% of organizations report shipping code more frequently since adopting AI tools. The “inner loop” is faster. Developers are writing more code, committing more often, and generating more pull requests than ever before.
Stat 10: 45% of deployments linked to AI-generated code lead to production issues. That speed-at-the-source creates a massive bottleneck downstream. AI code is often voluminous, lacks architectural context, and moves faster than manual testing and security workflows can keep up with.
Stat 11: 72% of organizations have experienced at least one production incident directly caused by AI-generated code. Not “almost caused.” Caused. The data suggests that AI, without automated governance in the delivery pipeline, acts as a productivity multiplier for bugs, not just features.
Stat 12: 71% of developers say constant context switching between fragmented AI tools is mentally draining. The problem isn’t that AI tools are bad. It’s that they’re disconnected. A developer using an AI coding assistant, a separate CI runner, a manual deployment script, and a siloed security scanner is context-switching constantly, which erodes the actual velocity gain.
That’s the gap Harness engineering addresses. Not faster code generation. Faster, safer code delivery.
What Harness Does to Developer Time
Productivity metrics are notoriously easy to manipulate. These numbers are harder to dismiss.
Stat 13: Developers spend 36% of their time on repetitive manual tasks. Copy-pasting configurations, chasing ticket approvals, manually triggering deploys. More than a third of engineering time in most organizations is consumed by work that delivers zero product value.
Stat 14: Harness Test Intelligence can accelerate builds up to 8x by running only tests relevant to specific code changes. The default behavior for most CI systems is to run every test on every commit. That’s safe but slow. Harness uses historical test data to identify which tests actually need to run, cutting build time without cutting coverage.
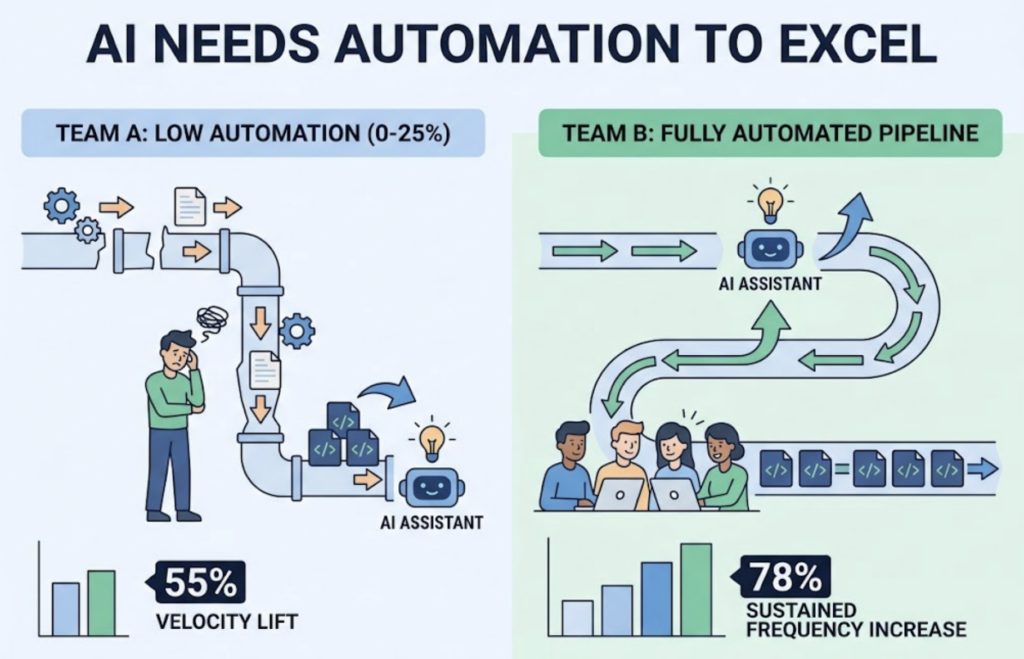
Stat 15: 78% of organizations with fully automated pipelines report a sustained increase in shipping frequency from AI adoption. This is the correlation that matters. Among teams with low automation (0–25%), only 55% saw a velocity lift from AI tools. Among fully automated teams, 78% did. The delivery platform is the ceiling for AI-driven productivity. If your pipeline is manual, your AI assistant’s output is queued behind human bottlenecks.
Stat 16: Choice Hotels reduced manual toil by 80% after deploying Harness. That’s not a percentage improvement in some niche metric. That’s 80% of the maintenance work that used to consume engineering cycles, gone.
What Customer Data Actually Shows About Harness Engineering
Case studies are easy to cherry-pick. But when multiple enterprise customers report structurally similar outcomes, it’s worth taking seriously.
Stat 17: Keller Williams achieved 6x more deployments per year and saved 3 weeks of delivery lead time per cycle.Six times the deployment frequency with a shorter lead time. That’s not the same team working harder. That’s the same team working on a different kind of infrastructure.
Stat 18: Ulta Beauty consolidated 36,000 pipelines down to 50. Thirty-six thousand pipelines. Each one maintained, debugged, and updated by someone. Reducing that to 50 doesn’t just save engineering hours. It removes an entire category of organizational complexity.
Deluxe saved the equivalent of 3 months of developer effort on a single project. That’s not a productivity tweak. That’s a full engineering cycle recovered.
The Market Context: Why Jenkins Is Losing Ground
Understanding Harness Harness stats means understanding the market it’s displacing.
Stat 19: Jenkins holds 40% market share and powers 80% of the Fortune 500, but adoption is declining at -8% year-over-year. Jenkins isn’t collapsing. It’s eroding. The primary friction point is what engineers call “Plugin Hell”: a state where updating one component can destabilize the entire build server. Maintaining Jenkins at scale has quietly become a full-time job for many platform teams.
GitHub Actions leads organizational adoption at 33%, with Jenkins at 28% and GitLab at 19%. Harness is smaller by adoption share but growing fastest in the enterprise segment, where governance, multi-cloud visibility, and canary deployment logic matter more than GitHub marketplace integrations.
Stat 20: Enterprises are projected to waste $44.5 billion on underutilized cloud resources in 2025. Cloud cost management is no longer a finance problem. It’s a developer problem. Harness CCM users have reported recovering $8,000 per day in savings on overprovisioned infrastructure, with some teams hitting $3 million in savings over five months. That’s the FinOps opportunity sitting inside the same platform as your CI/CD.
How Developers Are Actually Finding Tools Like Harness Now
The way developers discover platforms has shifted. Three years ago, a developer looking for a CI/CD tool would search Google, read a few comparison articles, and land on a vendor’s pricing page. That’s not the dominant pattern anymore.
Today, a developer asks ChatGPT: “What’s the best CI/CD platform for Kubernetes with built-in FinOps?” or queries Perplexity: “How does Harness compare to GitHub Actions for enterprise deployments?” The answer they get from that AI engine, not the link on page three of Google, shapes their consideration set.
This is where GEO (Generative Engine Optimization) and AEO (Answer Engine Optimization) come in. For any developer tools brand, the question is no longer just “do we rank?” It’s “are we cited?”
Topify tracks exactly this. It monitors how brands appear across ChatGPT, Gemini, Perplexity, and other major AI platforms, measuring visibility, sentiment, position, and whether AI engines are actively citing your brand when developers ask the questions that matter to your category. For Harness, that means questions about FinOps automation, DORA metrics tracking, or enterprise CI/CD pipelines.
If you’re in the developer tools space and you’re not measuring your AI search visibility, you’re flying blind in the channel where the next generation of tool evaluations is happening. Topify’s AI Volume Analytics surfaces the high-volume prompts your audience is already asking AI engines, and tracks whether your brand shows up in the answers.
Conclusion
The 20 stats above don’t paint Harness as a perfect product. They paint it as a platform that has earned a specific position in enterprise DevOps: the choice for organizations where governance, scale, and cost visibility matter more than ease of initial setup.
The AI Velocity Paradox is real. Shipping code faster without automating the delivery layer creates more production incidents, not fewer. The data on that is consistent across multiple research sources. Harness’s value proposition is essentially a quantified answer to that paradox.
For developers and engineering leaders evaluating their delivery stack, these numbers are the starting point for that conversation.
And for brands building in the developer tools space, the parallel lesson is clear. Your next customer is probably asking an AI engine which tools to use. Whether your brand shows up in that answer is a visibility problem that’s worth measuring. Topify is built to help with exactly that.
FAQ
What is the current valuation of Harness?
As of late 2025, Harness is valued at $5.5 billion following a $240 million Series E funding round led by Goldman Sachs Asset Management.
How many deployments does Harness handle?
In the trailing 12 months, Harness has powered over 128 million deployments and 81 million builds across its enterprise customer base.
What is the AI Velocity Paradox?
It refers to the gap between how fast AI tools help developers write code and how slowly most organizations can actually test, secure, and deploy that code. Data shows 45% of deployments linked to AI-generated code lead to production issues, and 72% of organizations have experienced at least one production incident caused by AI code.
How does Harness Engineering compare to GitHub Actions?
GitHub Actions leads organizational adoption at 33% and works well for simpler projects. Harness is positioned as the enterprise alternative, offering native Policy-as-Code via OPA, guided canary deployments, built-in FinOps, and Test Intelligence that can speed up builds up to 8x.
What is GEO and why does it matter for developer tool brands?
GEO (Generative Engine Optimization) is the practice of ensuring your brand appears in AI-generated answers across platforms like ChatGPT and Perplexity. As developers increasingly use AI engines to research and compare tools, GEO visibility is becoming as important as traditional search rankings for developer-focused brands.

