
Three separate 2026 studies set out to answer the same question: how visible is the average brand in AI search? One landed on a cross-industry median of 49 out of 100. A different 2026 report put the cross-industry median at the same 49, but built it from Pondral’s 200-brand sample scoring 55.8 on average against Foglift’s 4,217-brand sample scoring a 62 median for SaaS alone. A third measured something else entirely: non-branded mention rate, landing at roughly 31% in the middle of the pack.
Same general topic. Three numbers that don’t line up, because they’re not measuring the same thing the same way.
That’s the problem with the term “AI visibility benchmark” right now. It gets used for wildly different research designs, and most reports don’t tell you which one you’re looking at. If you’re about to cite a ranking in a board deck or a client report, here’s how to check whether the number underneath it will hold up.
Why AI Visibility Benchmark Studies Keep Disagreeing With Each Other
Start with how unstable the underlying data actually is. One study tracked 1,127 unique URLs cited by ChatGPT, Perplexity, Gemini, Copilot, and Google AI Overviews across 30 queries over six weeks. Only 119 of those URLs were still being cited by the end of the study. The rest had already been replaced.
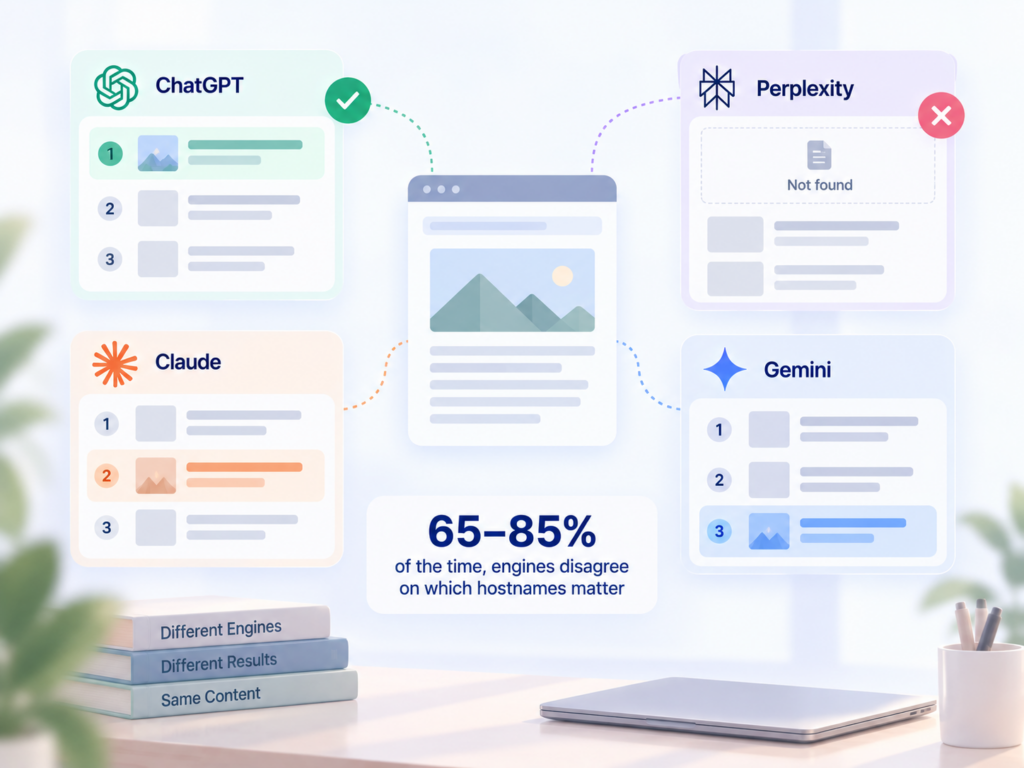
That’s not a one-off glitch. Research comparing citation behavior across engines found that the same page can be a top citation on ChatGPT and completely invisible on Perplexity, with engines disagreeing on which hostnames matter 65 to 85% of the time. A benchmark run on ChatGPT in March and one run on Perplexity in April aren’t measuring the same reality, even if both call themselves “AI visibility.”
Sample size compounds the problem. Statistically, a visibility rate near 25% measured over 72 answers carries a margin of error of about 10 percentage points, and it takes roughly 294 answers per period before a 10-point swing can be called a real trend instead of noise. A lot of published rankings never disclose how many answers they actually pulled.
Definitions vary too. Some studies count any brand mention. Others only count citations where the AI links back to a source. Mentions, citations, and links are three separate signals that measure different things and should never be collapsed into one number. A “top 10” list built on mentions and one built on citations can rank the same set of brands in a completely different order.
The Methodology Questions Most Reports Never Answer
Before you trust a number, there are four questions almost every credible study answers upfront, and almost every weak one skips.
How many prompts, and across how many platforms? One of the more rigorous studies manually checked 1,700 businesses across 32 industries and 3 countries, finding 88% weren’t appearing in ChatGPT at all. That’s a defensible sample. A report built on 20 queries against one engine is not, no matter how confidently it presents its findings.
Is the sampling method disclosed? Most AI-visibility tools sample only a fraction of what they claim to measure, and the sampling method is rarely spelled out in the marketing copy. If a report can’t tell you how it queried the models, it can’t tell you how much noise is baked into its score.
How current is the data? AI answers shift week to week as models update and content gets re-crawled. A benchmark that hasn’t been refreshed since last quarter is describing a version of the AI landscape that no longer exists.
Is the score reproducible? A credible measurement asks for a disclosed sample, a repeatable test, and multi-turn buyer journeys before a score is treated as decision-grade, rather than presenting a single chart as if it were proof.
Five Signals a Study’s Data Actually Holds Up
Once you know what to ask, spotting a solid study gets faster. Look for these five signals together, not just one of them.
A named, disclosed sample. Studies worth citing tell you the number of brands, prompts, and platforms up front. One 2026 benchmark evaluated 4,217 brands using 150-plus industry-specific prompts across multiple AI engines, and said so in the first paragraph.
Multi-engine coverage. A single-platform study can only speak to that platform. Reports that separate results by engine, rather than blending them into one composite score, are being honest about a fragmented reality.
Per-industry or per-segment breakdowns. Credible benchmark data shows median scores varying sharply by category, for example a blended median non-branded mention rate near 31% overall but ranging from under 12% at the bottom quartile to over 74% at the top decile. A single flat number across every industry is a warning sign, not a summary.
A visible methodology section. Strong studies publish the actual formula behind their score, down to the weighting of each component, so a reader can check the math instead of taking the grade on faith.
Willingness to show its own limits. Some research teams re-test their own scoring weekly and publish what changed and why, treating measurement error as something to audit rather than hide. That kind of self-correction is rare, and it’s a strong trust signal when you find it.
What a Fake or Cherry-Picked Ranking Usually Looks Like
Here’s the thing: bad AI visibility data rarely looks fake at first glance. It looks polished.
A few patterns are worth watching for. A report that only tests prompts where the sponsoring brand already performs well. A “visibility score” built entirely on one AI engine but marketed as if it covers “AI search” broadly. A ranking with no sample size anywhere in the document, just a chart and a headline number.
One team documented a case where an AI visibility audit looked entirely credible while actually measuring the wrong company, a failure traced back to entity resolution errors in how the tool matched brand names to citations. The dashboard looked fine. The underlying match was wrong.
Vendor comparison content is its own category of risk. Many tools measure whether a brand simply appears somewhere in an AI answer, which is a vanity signal, rather than whether the AI treats that brand as the actual source behind the answer, which is the signal that actually moves business outcomes. If a comparison article only tracks the first kind, its rankings will flatter tools that are easy to get mentioned by and say nothing about which ones drive real citations.
That’s the gap most brands still can’t see.
How Topify Makes Its AI Visibility Benchmark Data Verifiable
Topify builds its benchmarking around the standards above instead of around a single headline score. Rather than reporting one mention count, it tracks brand performance across seven separate metrics in one view: visibility, sentiment, position, volume, mentions, intent, and CVR, so a brand’s “we got mentioned” number never gets confused with what that mention was actually worth.
Coverage runs across the engines that actually carry buyer intent. Topify tracks brands across ChatGPT, Gemini, Perplexity, DeepSeek, Doubao, and Qwen, which matters for any team selling into more than one market, since a brand’s standing on Perplexity often looks nothing like its standing on a regional engine.
The sampling side addresses the noise problem directly. Instead of asking a question once, the platform probes each engine with multiple phrasings of the same query to build a statistically grounded picture of a brand’s presence, rather than relying on a single snapshot answer. That’s the same principle behind the sample-size math earlier in this article: more answers per comparison period means less noise in the trend line.
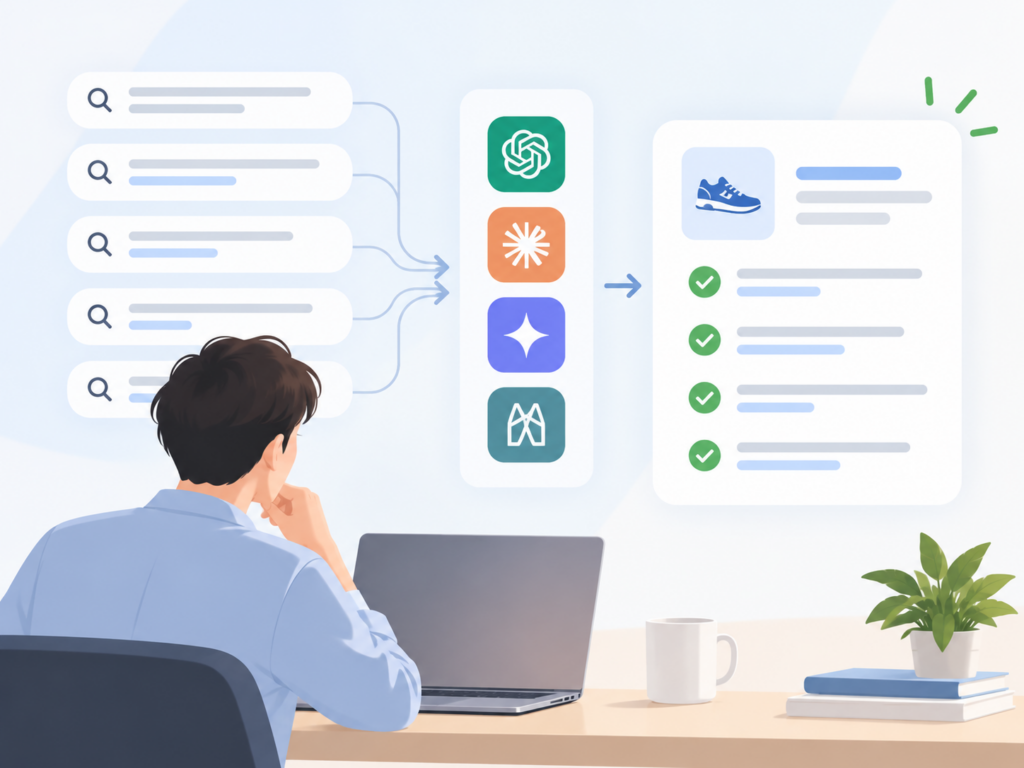
The traceability piece closes the loop. Topify reverse-engineers the exact domains and URLs an AI platform cites, so when a competitor keeps showing up in an answer and a brand doesn’t, the gap can be traced to a specific source rather than left as a mystery. That’s what “verifiable” should mean in this category: every score traces back to a query, an engine, and a citation you can go check yourself.
A Quick Checklist Before You Cite Any AI Visibility Study
If you can’t reproduce a number, don’t cite it.
Before a stat from any AI visibility report goes into a deck or a pitch, run it through four checks:
- Does it name the sample size, the number of prompts, and the platforms tested?
- Does it separate results by engine instead of blending them into one score?
- Does it publish, or at least describe, the actual scoring formula?
- Can you trace at least one data point back to a real, checkable citation?
If a report fails two or more of these, treat its headline number as directional at best, not something to build a decision on.
Conclusion
Credibility in this space isn’t about how big the sample sounds or how confident the headline is. It comes down to whether the methodology can survive someone actually reading it. The studies that hold up disclose their sample, separate their engines, publish their formula, and let you trace a score back to a real citation. The ones that don’t are guessing with better formatting.
Before you quote any AI visibility benchmark in a report or a client conversation, run it past the checklist above. It takes five minutes and it’s the difference between citing data and repeating a marketing claim.
FAQ
What is an AI visibility benchmark, exactly?
It’s a comparison point for how often AI engines mention, cite, or recommend a brand relative to peers, usually expressed as a score or percentage. The term gets applied loosely, so the same phrase can describe a rigorous multi-engine study or a single-platform snapshot.
Why do different AI visibility studies show such different numbers for the same industry?
Different studies use different sample sizes, different sets of AI engines, and different scoring models, which is why three independent 2026 benchmarks covering more than 3,000 brands still landed on different median scores for comparable industries.
Are AI visibility rankings from marketing vendors trustworthy?
Some are, some aren’t. The deciding factor isn’t who publishes the study, it’s whether the methodology is disclosed. A vendor-published study with a named sample size, multi-engine coverage, and a visible formula can be more reliable than an “independent” one that hides all three.
How often should AI visibility benchmark data be updated to stay accurate?
AI answers shift as models update and content gets re-crawled, so data older than a quarter should be treated cautiously. Studies that re-test on a weekly or monthly cadence and publish what changed are the most defensible to cite.
Can a small brand trust its own AI visibility number if the industry benchmark is based on huge brands?
Only if it checks the segment breakdown, not just the overall median. Benchmarks with real per-quartile data show a nearly 62-point spread between the bottom quartile and top decile within the same industry, so comparing a small brand’s raw score to an industry-wide average without checking segment size is misleading.