Your Google Analytics dashboard looks fine. Traffic is stable. Bounce rate is normal. Conversions are tracking.
But last Tuesday, a potential customer opened ChatGPT, typed “what’s the best tool for [your category],” and got a confident, detailed answer. Your brand wasn’t in it. You’ll never see that moment in any report.
That’s the gap. Google Analytics tells you what happens after someone chooses to visit you. AI Visibility Score tells you whether AI is recommending you before that choice is ever made. In 2025, those are two completely different questions, and most marketing teams are only answering one of them.
Google Analytics Has a Blind Spot. It Starts Before the Click.
GA was built for a world where search engines showed links and users clicked them. That world is changing faster than most dashboards reflect.
Zero-click searches have reached 60% across all searches, with mobile pushing that number to 77.2%. At the same time, AI Overviews now trigger on more than double the queries they did a year ago, jumping from 6.49% to 13.14% in just one year. When an AI Overview appears, organic click-through rates drop by 47%, from 15% to 8%.
Here’s the thing: when that happens, GA doesn’t alarm. It just shows fewer clicks. Your team debates whether it’s a seasonality issue or a content problem, when the actual issue is that the AI answered the question and the user moved on without ever clicking.
That’s the architectural limit of post-click measurement. GA starts when the user arrives. AI Visibility Score starts when the user asks.
What AI Visibility Score Actually Measures
An AI Visibility Score is a composite index, typically 0-100, that quantifies how often and how authoritatively a brand appears in AI-generated answers across platforms like ChatGPT, Gemini, Perplexity, and others.
It’s not a ranking. Rankings are deterministic. AI responses are probabilistic: the same query can produce different results across sessions, users, and platforms. So the score is built from a large sample of tested prompts, analyzed across multiple platforms, to establish a statistically valid baseline of brand presence.
The comparison to GA is direct:
| Dimension | Google Analytics | AI Visibility Score |
|---|---|---|
| Measurement point | After the user clicks | While the AI is generating the answer |
| Core question | What did users do on site? | Did AI recommend the brand? |
| Data source | Your own website | AI platform responses |
| Competitor data | Not visible | Directly comparable |
| Nature of data | Deterministic | Probabilistic (trend-based) |
Platforms like Topify build this score across seven distinct signals: visibility (raw mention frequency), sentiment (tone of the AI description), position (primary recommendation vs. secondary mention), volume (estimated user exposure), mentions (specific product recall), intent (alignment with the user’s query type), and CVR, which estimates the probability a specific mention leads to a high-intent visit.
That’s the full picture GA can’t see.
The 5 Signals That Go Dark in Your Analytics
Each of these five signals represents a specific strategic gap that AI visibility tracking fills.
Mention Rate. GA can only measure brands that were chosen. It has no concept of “filtered out.” When an AI narrows 50 competitors down to 4, the other 46 show nothing in their dashboards. If your brand ranks on page one of Google but appears in 0% of ChatGPT answers for the same query, your analytics look fine. Your future pipeline doesn’t.
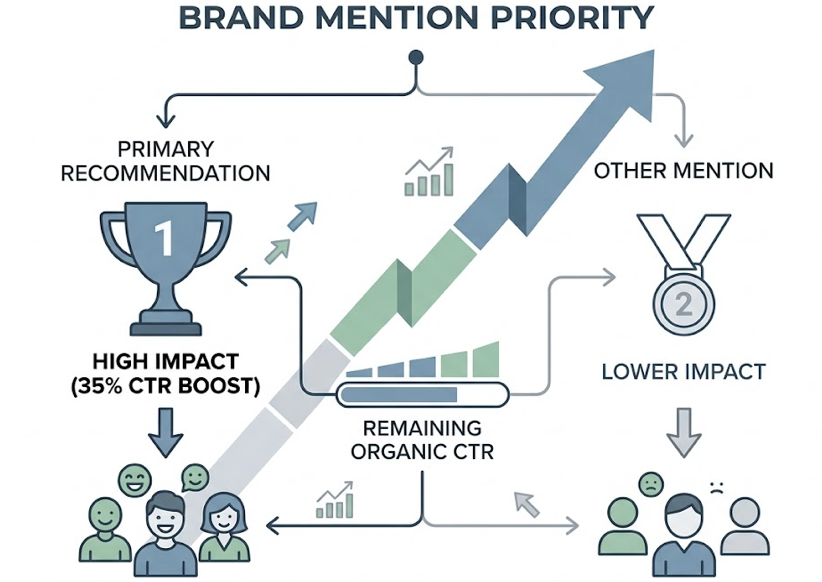
Position in the Answer. Not all mentions are equal. A brand named as the primary recommendation carries significantly more psychological weight than one listed under “you might also consider.” Research from 2025 shows that appearing in the top three AI recommendations results in a 35% boost in remaining organic CTR. GA sees all referral traffic as one session. AI visibility tracking tells you whether you’re winning the first slot or the consolation mention.
Sentiment. Before a user clicks, the AI has already framed your brand. Phrases like “market leader” and “best for growing teams” build trust. Phrases like “steep learning curve” or “better for enterprise” can quietly eliminate you from consideration for an entire buyer segment. GA can’t audit that framing. NLP-based sentiment scoring can.
Competitor Share of Voice. This is possibly the most valuable signal GA simply cannot provide. If your brand appears in 30% of tested prompts and a competitor appears in 85%, that 55-point gap is a concrete, measurable loss of influence in the recommendation funnel. You can see it, quantify it, and act on it.
Platform Variance. A brand can be highly visible on ChatGPT and entirely absent from Perplexity, and GA will show them as the same “AI referral” traffic bucket. ChatGPT relies heavily on training data and Bing integration, while Perplexity prioritizes real-time web retrieval. The fix for each is completely different. You can’t identify the problem, let alone solve it, without platform-level breakdowns.
A Score of 45 vs. 80: What “Good” Depends On
There’s no universal benchmark for a good AI Visibility Score. What matters is competitive context.
In B2B Tech and SaaS, AI Overviews now appear on 82% of queries. With so many competitors producing high-quality content, individual mention rates compress. Market leaders in this category typically score in the 30-40% mention rate range. A score of 45+ is considered strong. For less competitive niches, the target might be 60-70.
The absolute number matters less than two things: the trend over time, and the gap against competitors.
If your score is 52 and the industry average across your top ten competitors is 68, that 16-point gap isn’t an abstraction. It maps to specific prompt clusters where competitors are winning and you aren’t. Topify’s Competitor Monitoring surfaces exactly those gaps, showing whether you’re losing on “enterprise use case” queries, “pricing comparison” prompts, or a specific vertical you haven’t yet covered.
That’s the starting point for prioritization. Not “improve our score generally,” but “close the gap on these six prompt categories.”
Tracking Without Doing 2,400 Queries a Month
Manual tracking is how a lot of teams start. It doesn’t scale.
A brand monitoring 100 high-value prompts across four platforms weekly generates roughly 2,400 manual queries per month, before any analysis. That’s a part-time job, and it still misses real-time model updates.
There’s also a more technical problem. Many early-stage tools use model APIs to check visibility, but API-based results only overlap 24% with what actual users see in the consumer interface. The consumer versions of ChatGPT and Perplexity include real-time retrieval layers that APIs skip entirely. You’d be measuring a sanitized version of the product your customers actually use.
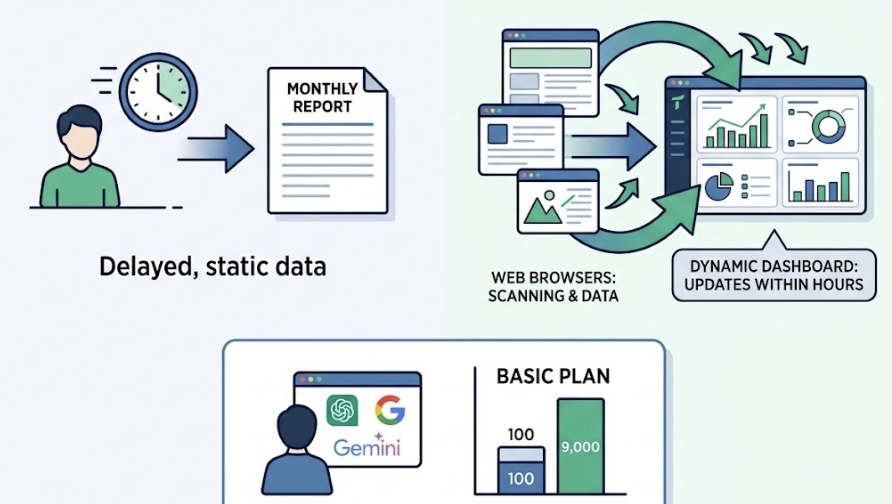
Topify solves both problems using browser simulation to capture what real users see, not API outputs. The Basic plan covers 100 prompts with roughly 9,000 AI answer analyses per month, across ChatGPT, Gemini, Perplexity, and others. The dashboard updates continuously, so a competitor content push or a model update shows up within hours, not at the next monthly report.
That’s the difference between visibility data and visibility intelligence.
Score Changes Tell a Story. Here’s How to Read It.
A score drop in week three doesn’t necessarily mean something went wrong.
When a model like GPT-4o or Claude is updated, internal brand authority weights can shift, and visibility changes typically take 2-4 weeks to stabilize as retrieval systems re-index the web. A single-week drop during a known model update cycle is noise. A four-week continuous decline is a signal.
The pattern to watch is this: if your score drops while a competitor’s score rises simultaneously, that’s not model drift. The AI has found a better answer than yours and is actively routing users toward it.
Also worth parsing: a drop on “how-to” prompts paired with a rise on “brand comparison” prompts often indicates a shift from educational authority to purchase consideration. That’s not a problem. That’s the funnel moving.
On the flip side, a sudden drop to near-zero across all platforms often points to a technical issue: a robots.txt change or JavaScript rendering problem that’s made the site invisible to AI crawlers. That one warrants immediate investigation.
The framework is simple. Trends over four-plus weeks beat single-point readings. Multi-platform drops beat single-platform anomalies. And a downward trend that mirrors a competitor’s upward trend is the clearest intervention signal in the data.
Turning Your Score Into a Number Your CFO Cares About
Most marketing leaders already understand AI visibility matters. The harder conversation is proving its financial value to someone who lives in the GA dashboard.
Here’s the logic chain that connects score to revenue. When AI Visibility Score improves on high-intent prompts, the brand appears in the synthesized answer that a buyer reads before shortlisting. That buyer then arrives at the site already pre-qualified. AI-sourced clicks convert at 4.4x to 23x the rate of traditional search clicks, because the AI has already done the comparison work.
That means a 15% improvement in visibility on high-intent prompts doesn’t just increase impressions. It increases the quality of every session that follows.
Topify’s CVR (Conversion Visibility Rate) maps visibility data directly to conversion intent, identifying which prompts drive the highest commercial value pipeline. That’s the number to bring to the CFO: “We improved our visibility by 15% on queries that account for 80% of our enterprise pipeline.”
For team goal-setting, the target structure is straightforward. Set a Share of Voice target against two or three specific competitors. Aim for a 10-15% improvement in mention rate on commercial intent prompt clusters within a 90-day window. Tie that to AI-sourced session volume in GA4. The story connects.
Low Score? The Fix Isn’t More Keywords.
A low AI Visibility Score is almost never a keyword problem. It’s an authority problem.
AI systems weight “web consensus” over self-reported brand claims. If ChatGPT is citing Wikipedia, G2, and TechCrunch for your category, getting mentioned in those publications matters more than updating your homepage copy. Topify’s Source Analysis shows exactly which domains AI platforms are currently citing for your target prompts. That’s your content placement map.
The second fix is prompt coverage. AI systems use a process sometimes called “query fan-out,” breaking a single user question into multiple sub-topics before synthesizing an answer. If your content covers “what is X” but misses “how to implement X” and “X pricing compared,” you’ll be filtered out of answers that start with a question you think you’ve covered.
Restructuring content also helps. Retrieval-Augmented Generation systems favor modular content: clear H2/H3 headings phrased as questions, followed by direct 40-60 word answers. That structure makes it significantly easier for AI to extract and cite your content as a supporting source.
For teams running this at scale, Topify’s Pro plan includes 250 prompts and 100 content generations per month, allowing teams to rapidly deploy the specific content blocks, proprietary data points, and structured answers that AI systems use to evaluate source quality.
Conclusion
Google Analytics isn’t going away. It’s still the right tool for measuring what happens after someone reaches your site.
But in 2025, 60% of searches end without a click, and the decision of which brands to recommend is being made inside AI platforms before your tracking script ever fires. GA measures the outcome. AI Visibility Score measures the selection process.
The practical path forward is four steps: establish a baseline across the major AI platforms, track how your score moves relative to competitors, fill the content gaps that AI systems are routing around, and connect visibility improvements to pipeline data that makes sense to the whole organization.
Both scorecards matter. Right now, most teams are only running one of them.
FAQ
What is an AI visibility score and how is it calculated? It’s a composite index, typically 0-100, measuring how often and how authoritatively a brand appears in AI-generated answers. It’s calculated by analyzing a large sample of prompts across platforms, weighting each brand appearance by mention rate, position in the answer, and sentiment of the AI’s description.
How does AI visibility score differ from traditional SEO ranking? Traditional SEO tracks your link position on a results page. AI visibility score tracks your mention share within a synthesized answer. A brand can rank first on Google and have zero AI visibility if the AI summarizes a competitor’s content instead of yours.
What is a good AI visibility score for my industry? It depends on competitive density. In B2B Tech/SaaS, a score of 45+ is strong because AI Overviews appear on 82% of queries and compress individual mention rates. In less competitive niches, 60-70 is a reasonable target. More important than the absolute number is whether it’s trending up and how it compares to your top three competitors.
How do I interpret changes in my AI visibility score over time? Single-week fluctuations are often model drift. Trends over four or more weeks carry strategic meaning. A continuous decline while a competitor’s score rises simultaneously is the clearest signal that intervention is needed. Changes typically stabilize 2-4 weeks after a model update.
How can I connect AI visibility score to revenue? Track AI-sourced sessions in GA4 separately. AI-referred visitors convert at significantly higher rates than traditional search visitors because the AI has already done comparison work before the click. Combine that with prompt-level CVR data to show which specific visibility improvements are driving high-intent pipeline.
How do I set AI visibility score targets for my marketing team? Anchor targets to competitor gaps rather than absolute numbers. A practical 90-day goal is a 10-15% improvement in mention rate on commercial intent prompts, measured against two or three named competitors. That framing makes targets specific, measurable, and tied to market share outcomes.

