A reporting team expands its prompt set, adds another platform, and updates a few market settings. The next monthly score moves sharply. Leadership sees one continuous chart, but the analyst knows that the system is now measuring a different collection of questions under different conditions.
An AI search monitoring dashboard needs a versioned baseline whenever material measurement choices change. A change register, a shared observation cohort, and clear chart annotations help separate performance movement from measurement movement. The aim is to keep the program adaptable while preserving an honest account of what each historical number means.
An AI Search Monitoring Dashboard Needs a Baseline Contract
Define a baseline as a measurement specification, not merely the first date on the chart. Record the prompt set, markets, languages, platforms or experiences, observation schedule, outcome definitions, weighting, and exclusion rules. Two values are directly comparable only to the extent that those conditions remain meaningfully aligned.
Keep configuration separate from outcomes. A prompt added because a new buying constraint matters is a configuration change. A competitor appearing more often in an unchanged prompt family is an observed outcome. Both deserve attention, but they answer different questions.
Assign a version identifier to the specification and attach it to every published report. A simple human-readable version can work if it resolves to the complete contract. The identifier alone is insufficient when nobody can reconstruct the settings it represents.
Document source-specific definitions as well. A provider’s first-party citation metric and your controlled prompt sample may cover different surfaces and populations. Combining them in one dashboard should not imply that they share a denominator or that a change in one explains a change in the other.
A baseline is a promise about comparability.
Classify Edits Before You Merge Them Into the Trend
Review each proposed change according to its effect on measurement. A corrected display label may leave the underlying series intact. Rewriting a prompt, changing market conditions, or revising the recommendation rubric can change what an observation means and may require a new version or a parallel series.
Use a short change taxonomy so the analyst does not make a fresh judgment from scratch each month. The table below is a proposed governance scheme; adapt it to your program’s actual measurement units and decision needs.
| Change | Comparability question | Suggested reporting treatment |
|---|---|---|
| Cosmetic label correction | Did the observation or interpretation change? | Retain the series and log the correction |
| Prompt wording or family change | Is the buyer decision still tested in the same way? | Create a version and preserve an unchanged cohort |
| Added platform or market | Did the observed universe expand? | Show expanded scope separately from common-scope results |
| Revised weights | Did the aggregate change without new answers? | Publish a new index version and disclose the weights |
| Updated labeling rubric | Would the same answer receive a different label? | Recompute only where raw evidence supports it; retain the prior release |
| Recovery of missing observations | Were values previously unknown or incomplete? | Mark the revision and record its source |
Give the change a reason and an owner. “More prompts” is not enough; identify the audience or decision gap that the expansion addresses. This helps prevent the monitoring program from accumulating questions simply because they improve a favorable score.
Specify the effective date before deployment. A mid-period change can leave one monthly total mixing incompatible conditions. Either separate the partial windows or postpone the change to a clean boundary when the business need permits it.
Bridge Old and New Versions With a Common Cohort
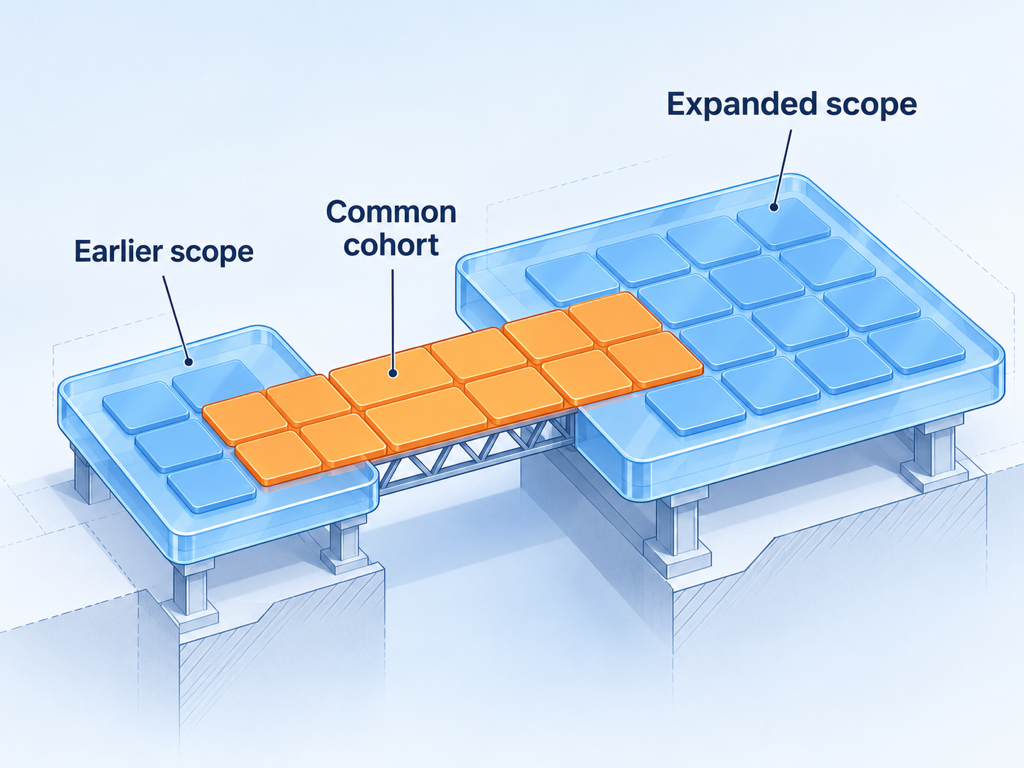
A common cohort contains the unchanged measurement units shared by both versions. Depending on your design, a unit may combine an exact prompt, platform, language, market, and observation schedule. Define that identity before calculating overlap; matching question text alone may not be enough.
Use the overlap to compare like with like, then show the expanded version alongside it. This does not force the new program to stay small. It lets readers see whether a movement persists within stable scope or mainly reflects newly added coverage.
Consider a hypothetical example. Version one contains 40 prompt units and version two contains 60, with 30 unchanged units in common. Evaluate the earlier and later periods on those 30 units, then report the full 60-unit program separately. The common-cohort trend and the expanded-program total answer different questions.
Keep the retained cohort representative of its stated scope. If the only unchanged prompts are branded navigational questions, their stability cannot validate a conclusion about unbranded discovery. Report which families remain in the overlap and which are missing.
A parallel observation window can help identify how the versions differ under similar timing. It still cannot guarantee identical model behavior or remove external changes. Use the bridge as a comparability aid, not as a universal conversion formula between two scores.
AI Citation Share: How to Benchmark Your Visibility Against Competing Sources provides related guidance on defining a reporting universe. Apply that discipline before presenting an old and new aggregate as one uninterrupted benchmark.
Annotate Structural Breaks Instead of Smoothing Them Away
Place a visible annotation where measurement changes materially. State the change in reader-facing language, such as added markets, a new platform, or a revised recommendation definition. Internal configuration codes can remain in the supporting register rather than crowding the chart.
Break the line when continuity would imply a comparison you cannot support. Two parallel series, a new baseline, or an explicitly labeled overlap view can be clearer than a single normalized score. Avoid applying an unexplained scaling factor just to make the transition visually smooth.
Separate external reporting incidents from your own configuration changes. Google’s Search Console anomalies log documents cases where logging or aggregation issues affected reported values. Such events need annotations even when your team did not change the content or measurement plan.
Explain the implication near the chart. A stakeholder needs to know whether the apparent movement can be read as an outcome, whether only a narrower cohort is comparable, or whether the period remains unresolved. A note buried in an appendix may not prevent a misleading headline.
Preserve the business consequence without inventing causality. Expanded monitoring may reveal an important gap that the old program missed. That is valuable discovery, even if it cannot be described as a new decline in performance.
Keep Historical Recalculations Reproducible
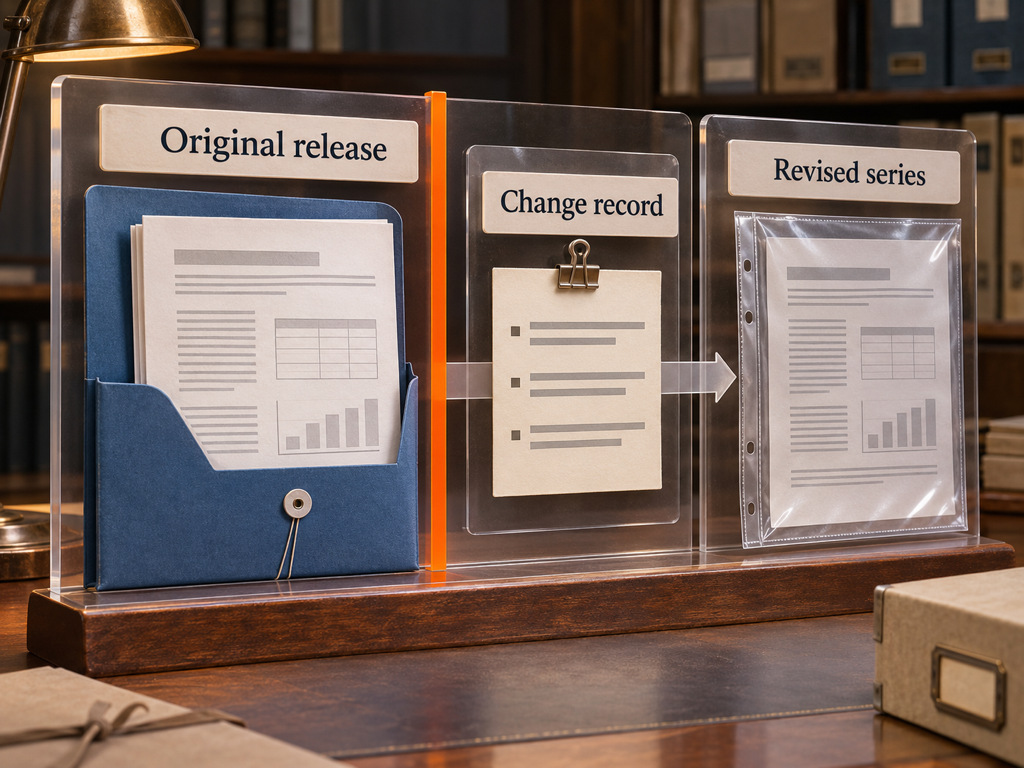
Preserve original observations and original report releases. When you recalculate history, create a new derived series with its own specification and publication date. Readers should be able to distinguish what was reported at the time from what a later method produces.
Record the transformation, input versions, exclusions, and reviewer. The W3C provenance model offers a useful basis for describing derivation and responsibility. In practice, a clear change register and retained inputs can be enough for a small team to reproduce a calculation.
Do not reconstruct evidence that was never captured. If the previous collector stored only a brand-presence flag, a new rubric requiring recommendation context may be impossible to apply historically. Label the gap and begin a new series rather than manufacturing detailed labels from insufficient records.
A parsing repair can justify a retrospective correction when raw answers remain available. Keep the old label, corrected label, repair reason, and date. A change in interpretation is different from an AI platform changing its answer, and your historical archive should preserve that distinction.
Set a policy for which historical view appears by default. The latest corrected series may serve ongoing analysis, while earlier releases remain accessible for audit. Explain material revisions to stakeholders so two downloaded reports with the same period do not appear to contradict each other without reason.
Keep the original release available after a recalculation.
Use Topify Consistency Controls With an Editorial Change Log
Topify can provide the monitoring context for a versioned reporting process. Its AI search analytics page describes consistency controls for region, language, and prompt templates, alongside brand visibility and source analysis. Use the controls available in your account to establish explicit conditions for each observation period.
Keep the reporting migration decisions in a separate change register. Record why a prompt family was added, which units remain comparable, what definition changed, and which chart should show a structural break. Product-level consistency controls do not remove the need for that judgment or guarantee that an external AI experience stays unchanged. Pair the platform evidence with a common-cohort report and a concise explanation of coverage, drawing on the Search Console field guide when incorporating first-party Google reporting. The output should let a stakeholder distinguish an expanded view of the market from a measured change within stable conditions, without assuming a native historical migration feature that has not been verified.
Conclusion
An AI search monitoring dashboard should evolve as the audience, product, and search environment change. A versioned baseline makes that evolution legible. It preserves the difference between discovering a new gap and observing a decline in a stable measurement universe.
Start with a baseline contract and a change register. Identify which edits affect comparability, preserve an unchanged cohort where possible, and annotate the point where a series needs a new interpretation. Keep original observations and published releases so later corrections remain reproducible. Topify’s AI search analytics capabilities can support consistent monitoring conditions, while your team owns the reporting bridge and its explanation. The next monthly review should show which movement reflects observed outcomes and which reflects a deliberate change in what the program measures.
FAQ
When does an AI visibility report need a new baseline?
When material changes to prompts, markets, platforms, weights, or outcome definitions make the earlier and later totals represent different measurement conditions.
Can old and new prompt sets be compared directly?
Only within clearly stated comparable scope. Use unchanged measurement units as a common cohort and show expanded coverage separately.
What is a common cohort in AI search monitoring?
It is the set of unchanged measurement units shared by two versions. Identity may include prompt wording, platform, language, market, and schedule.
Should historical visibility figures be recalculated?
Recalculate when retained evidence supports the new method and the purpose is clear. Preserve original releases, label the revised series, and do not reconstruct missing evidence.