Your brand holds the #1 ranking. Your rank tracker shows green. But your organic traffic is down 40%.
That’s the gap most SEO teams don’t see coming. It’s called “The Great Decoupling”: the moment when cardinal position and actual visibility stopped moving together. AI Overviews triggered it. And most tracking tools still haven’t caught up.
Your Rank Tracker Is Lying to You
Traditional rank trackers do one thing: they check where your URL sits in a list of blue links. That methodology worked for 20 years. It doesn’t anymore.
When an AI Overview appears, it occupies more than 75% of the initial screen on mobile and exceeds 1,200 pixels on desktop. The result? Your #1 organic result gets pushed below the fold before a user ever scrolls.
The CTR data confirms it. For informational searches with an AI Overview, organic click-through rate has dropped 61%, from a pre-rollout average of 1.76% down to 0.61%. For brands holding positions 2 or 3, the situation is worse: those placements are now effectively zero-value assets for any informational query.
Here’s the uncomfortable truth: rank and visibility are no longer the same thing.
A brand can sit at #8 organically and still be the primary cited source in an AI Overview, generating 35% more clicks than a non-cited competitor holding #1. A brand can hold #1 and be completely absent from the AI summary, absorbing the full weight of the traffic collapse.
Cardinal position has become a table-stakes metric. It matters, but it no longer defines whether users actually encounter your brand.
What “Ranking” Even Means in AI Overviews
AI Overviews don’t have a position 1, 2, or 3. There’s no ranked list of URLs. The system generates a synthesized narrative, and your brand either appears in it or it doesn’t.
This is a fundamentally different success model. The underlying mechanism is Retrieval-Augmented Generation (RAG): Google expands a single query into dozens of sub-queries, pulls fragments from authoritative sources, and synthesizes a final answer. More than 60% of AI Overview citations come from URLs that rank outside the top 20 of traditional search results. A page at position #40 for a specific sub-query can end up providing the primary evidence for an AI summary on a related head term.
That breaks every assumption traditional rank tracking is built on.
Measuring performance in this environment requires a different set of metrics. The most useful framework tracks seven dimensions: Visibility Rate (the share of relevant prompts where your brand appears), Brand Mentions (raw frequency in AI-generated text), Position Index (where in the response your brand is mentioned), Sentiment Quotient (how the AI characterizes you, on a 0-100 scale), AI Search Volume (prompt frequency within AI interfaces), Intent Alignment (whether you appear at the right buyer journey stage), and Conversion Visibility Rate (CVR), which connects AI mentions to actual revenue.
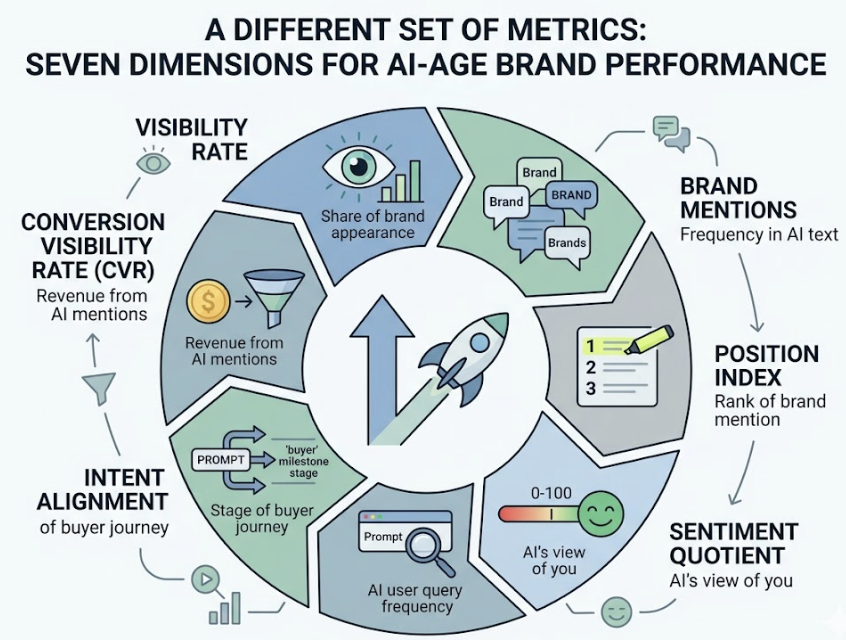
Of those seven, the three that matter most for day-to-day monitoring are Visibility Rate, Sentiment, and Position Index. Together, they answer the question your rank tracker can’t: are you actually in the conversation?
The 3 Signals That Actually Tell You Where You Stand
Move beyond cardinal position. These are the three signals that determine generative performance.
Signal 1: Trigger Rate
Trigger rate is the percentage of your target prompts where an AI Overview appears at all. Between early 2024 and mid-2025, overall AI Overview prevalence jumped from 6.49% to more than 50% of all search results. But the distribution is uneven by intent: informational and educational queries trigger AI Overviews 80-88% of the time. Transactional queries still trigger at only 1-13%.
Monitoring trigger rate tells you which segments of your prompt library are most exposed to zero-click displacement. If 85% of your TOFU keywords now trigger AI Overviews, your content strategy needs to shift from “ranking for clicks” to “engineering for citations.”
Signal 2: Inclusion Rate
Inclusion rate measures how often your brand appears in the AI summaries that do trigger. This is the new position #1.
Because LLMs are probabilistic, a single manual check is a snapshot, not a signal. You need to run dozens of prompt variations to calculate a reliable inclusion probability. If a competitor’s inclusion rate is rising while yours is flat, you’re losing Entity Salience, which is the model’s confidence in your brand as a leading solution for that topic.
Signal 3: Source Attribution
Source attribution identifies which specific domains and URLs AI Overviews pull from when building responses about your category. Analysis of 46 million citations shows that a small group of “aristocratic” domains (Wikipedia, YouTube, Reddit, and Google’s own properties) account for roughly 43% of all AI citations.
That’s the signal that tells you where to invest. If AI Overviews for your category are citing G2 reviews and Reddit threads instead of your owned content, you don’t have a content problem. You have an authority distribution problem. Topify’s Source Analysis tracks the exact domains and URLs that AI Retrievers ingest for a given prompt, across both your brand and your competitors.
Step-by-Step: Building a Monitoring Workflow
Here’s how to build a monitoring system that actually reflects generative performance.
Step 1: Build a Prompt Matrix
Replace keyword lists with a prompt matrix: a library of 25 to 100 context-rich, conversational queries that simulate real buyer journeys. A keyword like “email marketing” tells you little. A prompt like “which email marketing tool is best for a 50-person SaaS team with a $500 budget?” reflects how buyers actually use AI.
Over 80% of AI prompts are phrased differently than Google searches on the same topic. Your tracking input needs to match the actual input, not a legacy keyword format.
Step 2: Run a Baseline Audit
With your prompt matrix in place, run an initial audit across ChatGPT, Gemini, Perplexity, and AI Overviews. Record your Visibility Rate, Position Index, and Sentiment scores for each prompt. Include the top 3-5 competitors. The output is a “Visibility Gap” map: every query where a competitor is recommended and you’re not.
Step 3: Identify Source Gaps
For every gap, analyze what the AI is citing. Is a competitor dominating because they have a more comprehensive pricing table? A data-rich case study? A Reddit thread with high engagement? The answer dictates whether your response is a content update, a PR play, or a structured data implementation.
Step 4: Act and Re-Audit on a Weekly Cadence
AI citations are not stable. Cited sources churn at 40-60% monthly, and 70% of AI Overviews shift their primary narrative within a 90-day window. A monthly review cycle isn’t enough. You need to be watching for shifts on a weekly basis so you can respond before a competitor’s rising inclusion rate compounds into a structural visibility gap.
Manually auditing 500 prompts across four platforms takes hundreds of labor hours per month. Topify automates the entire pipeline, running audits in minutes with an error rate below 1%, while surfacing new high-value prompts as AI recommendations evolve.
The Tools That Can (and Can’t) Track AI Overviews
Not all monitoring tools operate at the same layer of the stack.
Legacy platforms like Ahrefs and Semrush remain strong for foundational SEO work: backlinks, technical audits, and cardinal rank. Their AI Overview coverage typically goes as far as trigger rate detection. You can see that an AI Overview appeared for a keyword. You can’t see whether your brand was in it, how it was characterized, or how you stack up against competitors inside the summary.
Specialized platforms are built specifically for the synthesis layer. They probe AI responses statistically, track brand presence across multiple LLMs simultaneously, and reverse-engineer citation trails.
| Platform | Core Advantage | Platform Coverage | Starting Price |
|---|---|---|---|
| Topify | 7-Metric Analytics + One-Click Execution | ChatGPT, Gemini, Perplexity, AIO | $99/mo |
| Profound | Enterprise Intelligence & SKU Tracking | 10+ Engines (Claude, Grok, etc.) | $499/mo |
| Quattr | GEO-SEO Bridge + Content Ops | ChatGPT, Perplexity, AIO | Custom |
| Ahrefs | Backlinks & Brand Radar | ChatGPT, Perplexity, Gemini, AIO | $129/mo |
| Otterly.ai | Light Visibility & Prompt Discovery | 6 Platforms (incl. Copilot) | $29/mo |
For teams that need to act on data, not just collect it, the key differentiator is whether the platform includes an execution layer. Topify’s Action Center connects monitoring insights to one-click content deployment, closing the loop between what the AI says and what your team does about it.
Measurement & Monitoring Mistakes That Skew Your Data
Getting the tracking set up is one thing. Getting it right is another.
Tracking short-tail keywords instead of prompts. Monitoring “CRM software” produces generic, concept-level AI answers that rarely mention specific brands. You need context-rich, long-tail prompts that match real buyer intent to get inclusion data that’s actually actionable.
Using rank as a traffic proxy. Stable organic rankings can mask a 40-60% traffic collapse caused by AI Overview displacement. If you’re only monitoring rank, you’ll be the last to know your pipeline is drying up.
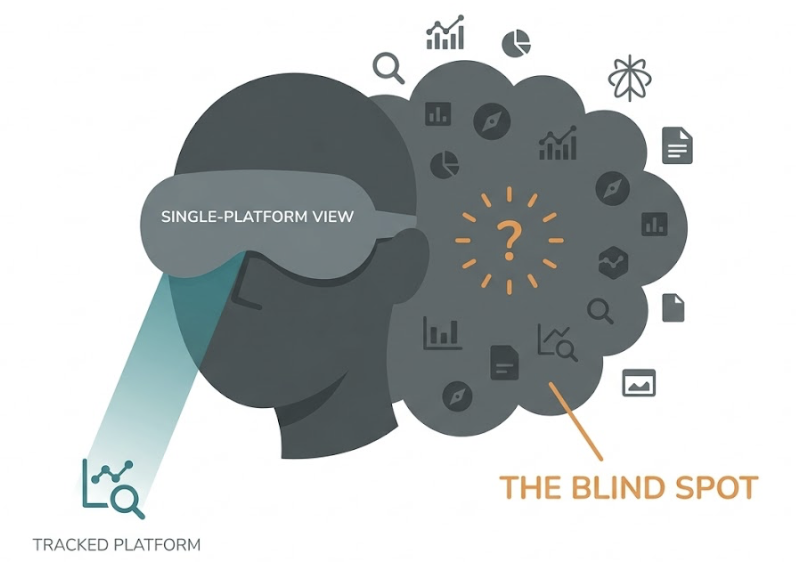
Tracking only one platform. Research shows only a 13.7% citation overlap between different AI search surfaces. What you see in ChatGPT tells you almost nothing about your visibility in Google AI Overviews or Perplexity. Brands that monitor a single engine are operating with a massive blind spot.
Siloing AI visibility from your existing reports. AI visibility isn’t a replacement for organic search metrics. It’s a parallel channel. Without connecting citation frequency to branded search lift and assisted conversions, you can’t prove ROI, and you can’t defend the investment to stakeholders.
Counting mentions, ignoring sentiment. If an AI characterizes your enterprise platform as a “budget option” or a “basic tool,” raw mention counts are irrelevant. The AI is filtering out your best prospects before they ever click. Sentiment tracking is not optional.
That last one shows up in more than half of the AI visibility reports we’ve reviewed.
What to Do With the Data Once You Have It
Data without a decision framework is just storage cost.
When your inclusion rate is low on specific prompts, start by analyzing what the AI is citing for those queries. AI systems don’t “read” content the way humans do. They extract facts and semantic relationships from fragment-level patterns. The fix is usually structural: restructure high-value pages into “Information Islands,” sections that lead with a clear, factual answer in the first 2-4 sentences, with structured data markup and a fact-dense HTML structure. Avoid client-side JavaScript rendering on any page you want AI crawlers to reach.
When source attribution shows that AI Overviews in your category prefer third-party sources over your owned content, the priority isn’t more blog posts. It’s earned media. One press mention generating 15 unlinked brand references on an authoritative domain may drive more AI visibility than 15 high-DA backlinks. Target the aristocratic domains: Reddit threads, YouTube reviews, G2 listings, and industry publications.
When it’s time to report up the chain, stop using rank screenshots. Use “AI Answer Inclusion Rate” and “Share of Model Presence” instead. These metrics reflect your brand’s actual role in the information ecosystem that drives discovery. And when you need the business case for continued investment in GEO, the “Citation Paradox” is your anchor: brands cited in AI Overviews recover roughly 35% of the traffic other brands lose to zero-click displacement. That’s the delta between a brand that’s invisible to AI and one that’s part of the answer.
Conclusion
Cardinal rank is not disappearing, but it’s no longer the scoreboard. In 2026, the brands that win search are the ones that show up in the answer, not just below it. That requires a different measurement system, a different prompt strategy, and a different relationship between your tracking data and your content decisions.
The monitoring shift isn’t complex. It’s a matter of replacing a single metric (rank) with a more accurate one (inclusion rate), and making sure your tools can actually see what’s happening inside AI-generated responses.
The traffic is still out there. It’s just flowing through a different layer.
FAQ
Do I need a separate tool to track AI Overviews?
General-purpose SEO tools can identify which keywords trigger an AI Overview, but they lack the statistical multi-model probing needed to measure actual brand inclusion, sentiment, and competitive position inside the summary. For benchmarking and execution, a specialized visibility platform is necessary.
How often does AI Overview content change?
Frequently. Cited sources rotate at 40-60% monthly, and 70% of AI Overviews shift their primary narrative within a 90-day window. Weekly monitoring is the minimum cadence to catch shifts before they compound into sustained visibility loss.
Can I track AI Overview performance for multiple competitors at once?
Yes. Platforms with parallel competitor tracking surface “Share of Model” data, showing which brands are preferred by specific LLMs and which third-party domains are fueling their authority. Topify’s Competitor Monitoring tracks position, sentiment, and citation sources across your full competitor set simultaneously.
What’s the difference between SGE and AI Overviews?
Search Generative Experience (SGE) was Google’s experimental phase for generative search features. AI Overviews is the production version, powered by the Gemini 3 model architecture since early 2026, and now active across the majority of search results.
How do I know if my content is being cited in AI Overviews?
URL-level source analysis in specialized tools tracks every domain and page that Google’s AI Retrievers pull for a given prompt. Topify’s Source Analysis distinguishes between your owned site, competitor pages, and third-party authority sources, so you can see exactly where the gap is.

