Tracking clicks and rankings won’t tell you if AEO is working. Here’s the measurement framework that actually does.
Your AEO strategy has been running for a few weeks. You open the dashboard, see the same organic traffic numbers, and wonder whether any of it is working. That’s the problem. The metrics you’re watching weren’t built for what you’re actually trying to measure.
Answer Engine Optimization operates on a completely different logic than traditional SEO. And if you’re still reporting success through rankings and CTR, you’re not measuring AEO performance. You’re measuring something else entirely.
Why Your Current Metrics Miss the Point
Traditional SEO assumed a simple chain: rank high, get clicked, drive traffic. That chain is breaking.
As of early 2024, 60% of searches in the United States end without a single click — up from just 26% two years prior. When AI Overviews or Perplexity synthesize a direct answer, there’s often no reason to click anything. And when AI Overviews do appear, the first organic position sees a relative CTR decline of up to 61%.
Here’s what makes this genuinely disorienting: the ranking–citation connection has fractured too. A February 2026 study found that only 38% of pages cited in AI Overviews also rank in the top 10 for the same query — down from 76% just seven months earlier. Your rank doesn’t predict your citation rate. At all.
The gap isn’t just a data problem. It’s a logic problem. Traditional metrics measure where your link is. AEO requires measuring what the AI is saying about you — with or without a link. That’s a fundamentally different question, and it needs fundamentally different tools.
Answer Inclusion Rate: The Metric AEO Starts With
Before anything else, you need to know whether your brand is actually showing up in AI-generated answers.
Answer Inclusion Rate (AIR) measures how often your brand appears in AI responses across a defined set of target prompts. Not impressions. Not potential visibility. Actual inclusion in the AI’s synthesis — the equivalent of being named in the answer the user receives.
The average brand has near-zero AI visibility, sitting around 0.3%. For market leaders, a realistic target is a 60–80% inclusion rate across core category prompts. Across a broader informational query set, top performers typically average around 12%.
Establishing your AIR requires building a “Prompt Matrix” — a library of query variations that reflect how real buyers talk to AI, not how they search Google. Research shows that 95% of sub-queries generated internally by AI models during a conversation have zero recorded search volume in tools like Ahrefs. Optimizing for keywords alone misses the vast majority of AI interactions.
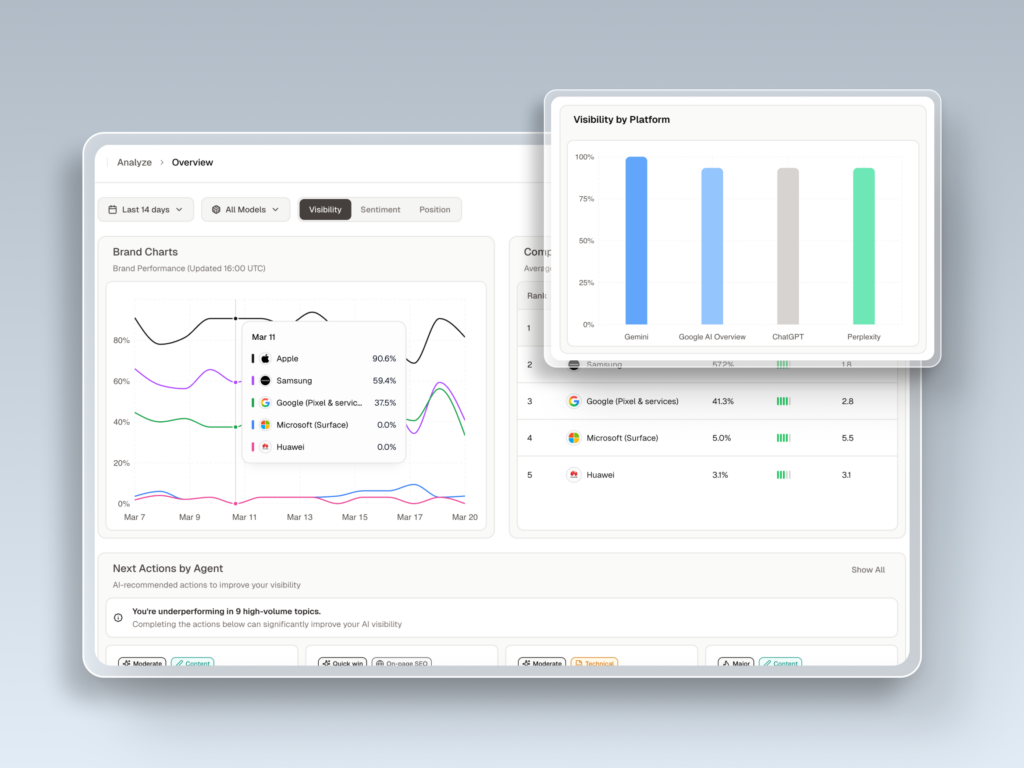
A meaningful AIR baseline runs these prompts across ChatGPT, Gemini, and Perplexity separately. You’ll often find significant platform gaps — a brand might appear in 15% of Google AI Overview responses but only 8% of Bing Copilot responses. That’s not a coincidence. It’s a citation authority gap that needs targeted action. Topify’s Visibility Trackingdoes exactly this across all major AI platforms in real time.
Sentiment Score: Not All Mentions Are Equal
Being included isn’t enough. What the AI says about you determines whether that mention converts.
An AI might mention your brand as “a budget alternative with frequent downtime” or “a legacy provider lacking modern features.” High inclusion rate, devastating commercial impact. That’s why Sentiment Score has become one of the most important AEO KPIs.
Unlike social listening, which analyzes what humans say, AEO sentiment analysis evaluates the machine’s attitude toward your brand — synthesized from training data and real-time retrieval. Topify Sentiment Analysis uses a 0–100 scoring system across dimensions like Innovation, Trust, and Product Quality. A score above 80 signals the AI perceives your brand as an industry leader. Below 40, you’ve got a problem that content alone won’t fix.
The sub-metric worth watching closely is Sentiment Velocity — the direction and rate of change in how AI models describe you. A downward velocity trend is often a leading indicator of a future sales drop, appearing before it shows up in customer surveys.
There’s also the Hallucination risk. If an AI is confidently citing your old pricing, attributing discontinued products to you, or misquoting your positioning, that’s a reputation crisis running quietly in the background. It requires immediate intervention: flooding the AI’s context window with corrective, authoritative data. You can’t fix what you can’t see.
| Sentiment Score | Interpretation | Action Required |
|---|---|---|
| 80–100 | Industry-leading recommendation | Protect and replicate authority signals |
| 60–79 | Above average, solid performance | Address minor negatives with targeted content |
| 40–59 | Meets basic expectations | Entity disambiguation and E-E-A-T improvement |
| 20–39 | Significant weaknesses | Reputation injection, review campaigns |
| 0–19 | Severe failure or crisis | Full digital footprint overhaul |
Position in Answer: First Mention Wins
In traditional search, position means your rank on a results page. In AEO, position means where you appear within the AI’s synthesized response.
That’s not a minor distinction. LLMs tend to front-load their primary recommendation. Users overwhelmingly stop their discovery process at the first or second option mentioned. Being named third in a list of five isn’t the same commercial outcome as being named first, even if your total mention frequency is identical.
A normalized 0–100 AI Visibility Score assigns weighted values based on prominence:
- 5 points: Primary recommendation, named in the first paragraph
- 3 points: Secondary mention or comparative alternative
- 1 point: Brief passing mention
- 0 points: Not present
A brand with an AVS above 70 is effectively the category default — the near-universal recommendation across models.
This is also where Share of Model (SOM) analysis becomes essential. Your brand might appear in 40% of relevant AI responses, but if a competitor consistently occupies the first position while you’re third, their effective SOM is higher. In B2B purchase cycles, being mentioned third means you might not make the shortlist before the first sales call happens.
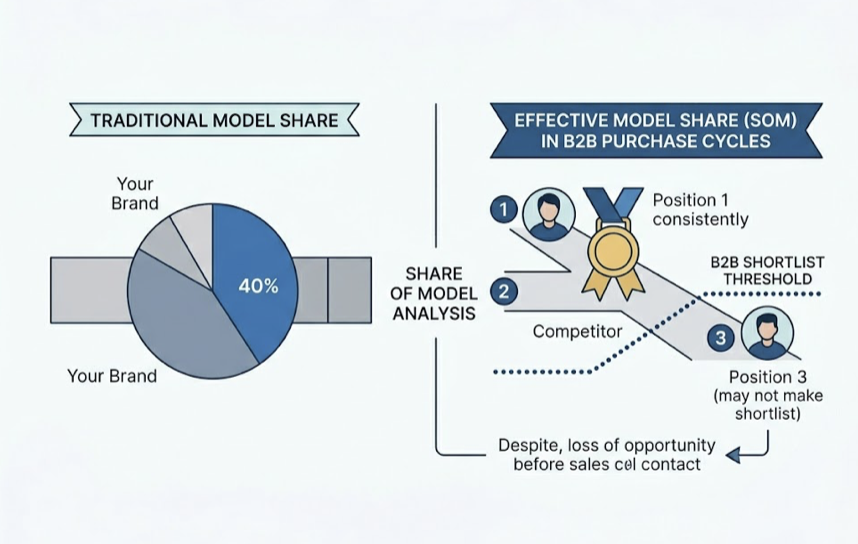
Topify’s Position Tracking monitors this in real time, with cross-competitor benchmarking built in.
Source Citation Rate: The AEO Leverage Point
Citation Rate tracks how often an AI platform explicitly credits your domain or URL as a source. This is more than a mention — it’s an endorsement. It signals that the AI treats your content as a “unit of truth.”
In Retrieval-Augmented Generation (RAG) systems, the AI retrieves grounding facts before synthesizing. Being cited means your content has high retrieve-ability and information density. Pages with high factual density — containing verifiable statistics and dated research — average approximately 10.18 citations each, compared to just 2.39 for thin or marketing-heavy pages. Additionally, 85% of citations come from content less than two years old. Freshness matters.
To optimize for citations, the shift is from the “Article Model” to the “Atomic Content Model” — breaking information into discrete, machine-digestible fact units. The structure that performs:
| Citation Signal | Optimization Strategy |
|---|---|
| Semantic Clarity | Lead with definitional opening sentences |
| Factual Density | Include a statistic every 150–200 words |
| Structural Logic | Answer-first formatting with clear H2/H3s |
| Freshness | Update core facts every 30 days |
| Entity Confidence | Implement detailed JSON-LD Schema markup |
Citation Gap Analysis takes this further. By reverse-engineering AI footnotes, you identify exactly which domains the AI trusts for your category. If a competitor is being cited more frequently, the question becomes: what’s their fact-to-word ratio? What’s their schema structure? Topify’s Source Analysis surfaces this automatically, including cases where the AI is citing outdated negative reviews or a competitor’s biased documentation.
That’s the gap most brands still can’t see.
CVR: The Metric That Translates AEO Into Revenue
The question every CMO eventually asks: if clicks are declining, how do I justify AEO investment?
The Conversion Visibility Rate (CVR) is your answer. It’s the percentage of tracked queries where your brand’s AI visibility translates into downstream intent or revenue. Not traffic volume — qualified commercial impact.
Here’s the thing: users who click through from AI citations typically arrive with high intent. They’ve already received a recommendation and are finalizing a decision. Studies suggest AI citation traffic converts at rates up to 12.9x higher than traditional organic search visitors. The volume is lower. The quality is not.
The harder attribution challenge is zero-click value. Users who see your brand recommended in ChatGPT may not click anything — but they often search your brand directly later, or navigate to your site within hours. Measuring the lift in branded searches and direct traffic that follows an increase in AIR is how you start to quantify “Assisted Discovery ROI.”
For leadership reporting, use the Return on Content Investment (ROCI) framework:
ROCI = (Value of Direct Conversions + Value of Assisted Discovery) / Total Cost of AEO Tools and Content
This reframes AEO not as a traffic channel, but as a shortlist channel. In B2B cycles especially, being absent from the AI’s synthesized briefing means you’re effectively excluded from the consideration set before anyone picks up the phone.
How to Build an AEO Reporting Dashboard
An AEO dashboard needs to do one thing well: make AI performance legible to stakeholders who still think in SEO.
Structure it in layers:
Visibility Layer: Overall AI Visibility Score (0–100) and Answer Inclusion Rate across your Prompt Matrix. Include a 90-day trend line. This is your headline number.
Competitive Layer: Share of Model vs. your top three competitors, displayed as a bar chart. This is the most defensible way to show market influence. Use the “Detergent Example” to explain: a brand might hold 24% SOM on one AI platform and 0% on another. Platform diversification isn’t optional.
Sentiment Layer: Sentiment Velocity and the positive/neutral/negative breakdown by topic cluster. Flag any cluster where negative sentiment exceeds 10%.
Technical Layer: Citation Frequency and Schema Health. Identify which specific pages on your site are being most frequently retrieved.
Impact Layer: CVR and attributable business outcomes — direct AI referral sessions, estimated lift in branded search volume, and dark traffic conversion estimates.
On reporting cadence: weekly scans for Sentiment Velocity and Position (AI citation patterns can shift completely after a single model update), monthly audits for Citation Gap Analysis and SOM reports, quarterly strategic reviews to re-evaluate the Prompt Matrix and justify continued ROCI.
One more practical note. Research shows that citation overlap between Google AI Overviews and ChatGPT is only 13.7%. A single-platform measurement strategy is structurally blind. Tracking across ChatGPT, Gemini, Perplexity, and regional engines like DeepSeek isn’t a nice-to-have — it’s the baseline for accuracy.
Topify monitors all of this simultaneously across platforms, with real-time querying rather than estimates or projections.
Conclusion
The brands winning in AI search aren’t necessarily the ones with the highest domain authority or the most backlinks. They’re the ones the AI has been trained to trust — and that trust is built through measurable, trackable signals: inclusion rate, sentiment, position, citation authority, and conversion visibility.
The measurement framework isn’t complicated. But it does require letting go of metrics that were designed for a different search model. Clicks and rankings tell you where your link is. AEO metrics tell you what the AI thinks about your brand — and that’s the question that actually determines whether you make the shortlist.
FAQ
What’s a good Answer Inclusion Rate benchmark?
The average brand sits at approximately 0.3% AI visibility. For market leaders, a realistic target is 60–80% inclusion on core category prompts. Across a broader informational query set, top performers typically average around 12%. Use industry benchmarks to contextualize: SaaS brands average 2.1%, while Financial Services averages 3.4%.
How often should I measure AEO performance?
Weekly monitoring for Sentiment Velocity and Position is the operational standard. AI platforms update models and retrieval patterns frequently — waiting a month to detect a sentiment drop could mean significant pipeline damage. Monthly deep-dives on Citation Gap Analysis, quarterly strategic reviews of the full Prompt Matrix.
Can I track AEO across multiple AI platforms at once?
Yes, and it’s required for accuracy. Citation overlap between Google AI Overviews and ChatGPT is only 13.7%, meaning a single-platform view misses the majority of your brand’s AI exposure. Professional platforms like Topify query actual AI engines in real time across ChatGPT, Gemini, Perplexity, and others — not traffic estimates.
How is AEO measurement different from GEO measurement?
GEO (Generative Engine Optimization) is the broader discipline covering the full generative ecosystem, including vector embeddings and semantic proximity. AEO is a specific subset focused on the answer-retrieval layer — ensuring your content is selected when an AI needs a source for a specific fact or direct recommendation. AEO metrics sit inside the GEO measurement framework.
What’s the best way to report AEO ROI to leadership?
Use the ROCI (Return on Content Investment) framework: compare the cost of AEO-optimized content and tools against the value of direct conversions plus estimated Assisted Discovery impact (branded search lift, dark traffic). Frame AEO as a shortlist strategy, not a traffic channel. In B2B cycles, being absent from the AI’s synthesized briefing means exclusion before the first sales conversation.

