Your analytics dashboard looks fine. Sessions are stable. Bounce rate is normal. Rankings haven’t moved.
But somewhere right now, a potential customer is asking ChatGPT which tool to use in your category. And your brand isn’t in the answer.
That’s the gap most teams still can’t see — because they’re measuring the wrong things. Traditional SEO metrics track what happens after a click. In 2025, the decision happens before one. If your KPI stack still starts with organic traffic, you’re not measuring AEO performance. You’re measuring something that no longer reflects how your buyers discover you.
This article breaks down the seven KPIs that replace rankings in the AI search era, how to report them to stakeholders who still think in clicks, and the three measurement mistakes that quietly make your data useless.
Your Analytics Look Fine. Your AI Presence Might Not.
Search volume is actually up. Global daily search queries are projected to hit between 9.1 billion and 13.6 billion in 2025, driven by AI-integrated platforms. But those searches aren’t producing the same clicks they used to.
About 60% of Google searches in 2025 end without a single click. On mobile, that number climbs to 77.2%. When AI Overviews appear, top-of-page click-through rates drop by 58%, and the cited sources inside those overviews earn only around 1% CTR. Information query CTR has fallen from a 15-19% range down to roughly 8%.
The result: B2B sites are seeing baseline referral traffic decline by 34%, even as search volume increases.
Here’s what this means for measurement. User discovery now happens before a click is ever made. Brand recognition forms inside the AI response itself. A user who read a ChatGPT answer recommending your product and went directly to your site won’t show up in organic search attribution. They’ll look like direct traffic, or dark social, or nothing at all.
That’s not a traffic problem. It’s a visibility measurement problem.
The 7 AEO KPIs That Replace Rankings
These aren’t supplementary metrics. For any brand with meaningful exposure to AI-driven queries, these are the primary indicators of search performance.
1. Visibility Rate
Visibility Rate measures how often your brand appears in AI-generated answers across a defined set of target prompts. It’s calculated as the percentage of tracked queries where your brand shows up.
This is the north-star metric for AEO. It doesn’t track where your page ranks. It tracks whether you’re present in the conversation at all.
Strong B2B SaaS companies typically target 10-15% as an initial benchmark. Market leaders tend to hold above 30%. The right number is heavily industry-dependent: healthcare AI Overviews trigger at a 48.7% rate, making 30%+ visibility table stakes for category authority. Real estate AIO triggers only 4.4% of the time, so a 10% visibility rate there already signals market leadership.
2. Position / Mention Rank
Not all mentions are equal. Being named first in a ChatGPT response carries a fundamentally different weight than appearing in a closing “you might also consider” list.
In Perplexity-style roundups, a first-position mention signals that AI systems have categorized your brand as the primary entity in that topic space. It shapes the context of everything that follows in the response. Second and third mentions carry real value, but the drop-off is significant.
Track this as a distribution: what percentage of your brand appearances are first-mention, mid-response, or trailing? Watch how it moves relative to competitors.
3. Sentiment Score
Being mentioned and being recommended are not the same thing.
Sentiment Score uses natural language processing to analyze the tone AI platforms use when describing your brand, typically on a 0-100 scale. If an AI response reads “Brand X has a strong feature set, though users frequently report slow support response times,” your visibility number looks fine. Your conversion potential doesn’t.
This score evaluates literal language, surrounding context, and the credibility weight of the sources being synthesized. A brand with 25% visibility and a 78 sentiment score will consistently outperform a brand with 40% visibility and a 54 sentiment score.
4. Share of Voice
Share of Voice (SOV) measures your brand’s AI mention share relative to competitors across a relevant topic cluster. If an AI response lists five solutions in your category and your brand accounts for two of those slots, your SOV on that prompt is 40%.
This is the metric that translates most cleanly for executives. In an environment where AI satisfies 60% of search queries, AI Share of Voice is a direct proxy for future market share. It’s the competitive scoreboard your leadership team already understands.
5. Source / Citation Coverage
This metric tracks which specific domains and pages AI platforms draw from when mentioning your brand. More importantly, it reveals AI’s “trust neighborhoods”: the third-party platforms (Reddit, Wikipedia, vertical media, industry analysts) that AI systems treat as authoritative sources about your category.
Citation Coverage lets you reverse-engineer AI trust paths. If Perplexity is citing three competitor case studies from a niche industry forum you haven’t touched, that’s a specific content distribution gap, not a generic “create more content” problem.
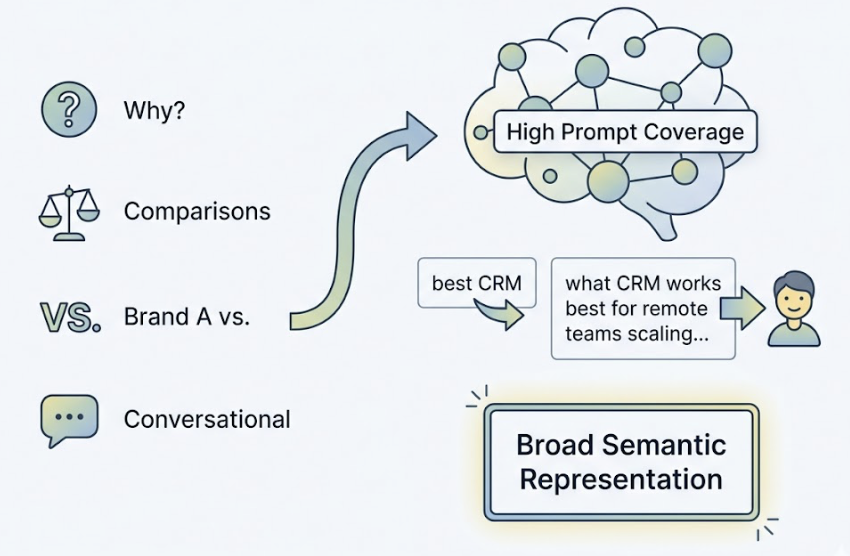
6. Prompt Coverage
Traditional SEO tracks rankings for a finite keyword list. Prompt Coverage measures how many distinct query types, phrasings, and intents trigger your brand to appear.
This includes “why” questions, “how to choose” comparisons, “Brand A vs.” queries, and long-form conversational prompts with subjective modifiers. High Prompt Coverage indicates broad semantic representation inside AI knowledge models, not just keyword matching. It’s the difference between a brand that shows up for “best CRM” and a brand that shows up for “what CRM works best for remote teams scaling past 50 people.”
7. CVR: Conversion Visibility Rate
The click volume is lower. The intent behind those clicks is significantly higher.
AI-referred traffic converts at 4.4 times the rate of traditional organic search. In some documented cases, ChatGPT referral traffic converts at 16%, compared to Google organic’s average of 1.8%. CVR estimates the probability that an AI recommendation leads to a downstream commercial action: a signup, a demo request, a purchase.
This is what closes the ROI argument for AEO investment.
AEO vs GEO KPIs: Same Framework, Different Baselines
These seven metrics apply to both Answer Engine Optimization and Generative Engine Optimization, but the execution context differs.
| Dimension | AEO | GEO |
|---|---|---|
| Primary targets | Google AI Overviews, voice assistants, featured snippets | ChatGPT, Gemini, Perplexity, Claude |
| Content style | Short, extractable, answer-first | Semantically rich, comprehensive, data-heavy |
| Visibility baseline | AIO trigger rate by industry | Chat-based prompt response frequency |
| Citation sources | Google’s crawl index | Training data + real-time retrieval (RAG) |
| Key technical signals | FAQ/HowTo schema, conversational tone | E-E-A-T signals, third-party authority, freshness |
| Sentiment measurement | Snippet tone | Synthesized narrative tone |
The overlap is real: brands that rank well on AEO Visibility Rate tend to perform well on GEO Prompt Coverage. But a brand that’s dominated Google AI Overviews can still be invisible on ChatGPT. Platform-specific tracking is non-negotiable.
How to Report AEO KPIs to People Who Still Think in Clicks
The biggest internal obstacle to AEO strategy usually isn’t budget. It’s a CMO or CFO asking “where are the numbers I recognize.”
Use translation, not terminology.
Visibility Rate ≈ Qualified Impressions. Frame it as the number of AI-driven decision conversations where your brand was present. Unlike ad impressions, these are AI-endorsed placements at the top of the user’s decision funnel.
Share of Voice = Competitive Market Position. This is language senior leaders already use. A 40% AI SOV in your category means you’re winning the AI recommendation market by a 2:1 margin over your nearest competitor.
Report change, not absolutes. AI models update frequently. About 40-60% of AI Overview citation sources rotate monthly. What matters to leadership is trend direction: is your Visibility Rate climbing, holding, or losing ground? Establish a baseline and report variance, not a single data point.
For the ROI case, NerdWallet is the clearest analogy available: a 20% decline in organic traffic, paired with a 35% revenue increase, driven by becoming a primary AI citation source. The clicks went down. The qualified intent traffic went up.
3 Measurement Mistakes That Make Your AEO Data Useless
Treating ChatGPT as the Entire AI Ecosystem
Different AI platforms have up to 615 times variance in how they select sources. Google AI Overviews cite YouTube at a 25% rate. ChatGPT’s YouTube citation rate is under 1%. A brand with strong Google AIO presence can be nearly invisible on Perplexity. A brand dominating ChatGPT responses may not appear in AI Overviews at all.
Single-platform tracking doesn’t give you a partial picture. It gives you a misleading one.
Calling Mentions the Same as Positive Mentions
A simple keyword monitoring tool tells you whether your brand appeared. It doesn’t tell you how it was described.
In generative AI environments, LLMs synthesize patterns from thousands of sources, including user forums. If your brand has consistent negative patterns in Reddit threads, AI may surface those as recurring context in responses, and repeat that framing to every user asking a relevant question. A brand with 30% visibility and a sentiment problem is in worse shape than a brand with 15% visibility and a clean sentiment signal.
Visibility without sentiment is an incomplete, and potentially dangerous, metric.
Only Tracking Keywords You Already Know
Most SEO teams monitor the queries in their existing keyword database. But AI users interact in long-form, highly specific, often subjective prompts: “which CRM is best for a team that does a lot of async work and doesn’t want to deal with complex onboarding.”
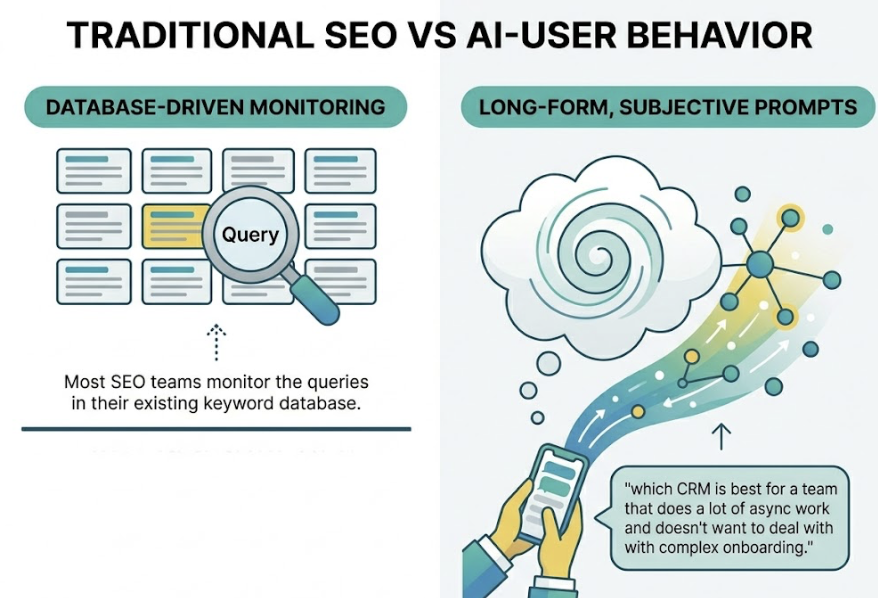
These “dark queries” don’t appear in your keyword planner. Without prompt expansion techniques to surface how real users are phrasing AI conversations about your category, your Prompt Coverage will always look higher than it actually is, and you’ll miss the exact moments where purchase decisions are forming.
Building Your AEO KPI Dashboard: What to Track and When
AI visibility shifts faster than traditional search rankings. Monitoring frequency needs to match that pace.
Weekly: Track Visibility Rate changes and competitor Share of Voice. Flag sudden drops and run prompt retests to check whether key pages have been de-indexed by AI crawlers or lost citation weight.
Monthly: Review Sentiment Score trends, Source Coverage changes, and the stability of cited URLs. Audit AI trust sources and identify which third-party platforms are gaining citation weight in your category.
Quarterly: Assess Entity Authority Score and Prompt Coverage expansion. Update structured data markup and adjust site content architecture to align with current AI extraction patterns.
For teams that need this at scale, Topify structures all seven of these dimensions into a single monitoring matrix: Visibility, Sentiment, Position, Volume, Mentions, Intent, and CVR tracked across ChatGPT, Gemini, Perplexity, and other major AI platforms. In a B2B SaaS scenario, for example, Topify surfaces where a competitor has displaced your brand by publishing updated benchmark data or securing new third-party citations, and surfaces one-click optimization actions — like generating comparison tables formatted for AI extraction or identifying the specific content gaps driving the position shift.
The dashboard architecture that works best layers four data levels: where your brand surfaces across AI platforms (surface), which content types AI preferentially cites (asset), which prompt intents you’re covering (prompt), and what downstream commercial behavior results (outcome). Most teams start with surface and skip straight to outcome. The asset and prompt layers are where the actual optimization signal lives.
Conclusion
The measurement gap in most marketing teams right now isn’t a data problem. It’s a framework problem.
Traffic dashboards are optimized for a world where clicks were the primary signal of discovery. That world is eroding. When 60% of searches resolve without a click, and when the highest-intent traffic comes from AI referrals that look like direct visits, the old metrics don’t just underperform. They actively hide what’s happening.
Visibility Rate, Share of Voice, Sentiment Score, Position Rank, Source Coverage, Prompt Coverage, and CVR — these aren’t additions to your KPI stack. For any brand with real exposure to AI-driven search, they’re the primary scorecard.
The brands building measurement fluency in these areas now will have 12-18 months of competitive insight before the rest of the market catches up.
FAQ
Can I track AEO KPIs without a paid tool?
Manual spot-checking is possible, but structurally misleading. Because LLM outputs are probabilistic, the same prompt can return different results across queries. Professional tools use large-scale repeated sampling to build statistical averages of brand performance across hundreds of thousands of potential user interactions. A manual audit of 20-30 queries typically takes 8-12 hours and captures a single moment in time. Automated tools cover thousands of variants in 2-4 hours and return a reliable mean performance score.
How fast do AI visibility metrics change?
Fast. Between 40-60% of AI Overview citation sources rotate every month. This isn’t traditional ranking drift. It reflects model updates, real-time retrieval (RAG) weight adjustments, and new data source integration. Continuous monitoring, not periodic auditing, is the right operational model.
What’s a good Visibility Rate benchmark for my industry?
It varies significantly. In healthcare, AI Overviews trigger on 48.7% of relevant queries, making 30%+ visibility necessary to maintain category authority. In real estate, AIO triggers only 4.4% of the time, so 10% visibility already represents market leadership. For most B2B SaaS categories, 10-15% is a healthy starting benchmark. Above 30% is market leader territory.
Is zero-click actually hurting my brand, or is it neutral?
For ad-revenue-dependent publishers, it’s damaging. For brand marketers, it’s a reallocation of where value gets created. The direct referral traffic that disappears tends to be lower-intent. What remains converts at 4-5x the historical rate. Plus, repeated brand mentions in AI responses build top-of-mind awareness even without a click, compounding into long-term brand equity in ways that don’t show up in session counts.

