
You’re getting traffic. Maybe even a lot of it. But the revenue isn’t moving the way it should.
Here’s the uncomfortable truth: the global average website conversion rate sits between 2% and 4%. That means for every 100 visitors you’ve paid to acquire, roughly 96 leave without taking any meaningful action. The traffic budget grows. The conversion number stays flat. And somewhere in a monthly report, someone suggests running more ads.
That’s not a traffic problem. That’s a yield problem.
Conversion rate optimization (CRO) is the discipline of closing that gap. But done right, it’s not about tweaking button colors or rewriting headlines on instinct. It’s a structured, evidence-based process of diagnosing friction, testing hypotheses, and compounding marginal gains into significant revenue lifts. This guide breaks down how that process actually works in 2025.
High Traffic, Low Conversions: The Gap Most Analytics Tools Can’t Explain
Three structural failures cause the conversion gap in almost every case.
The first is intent mismatch. When users with informational intent land on transactional pages, they bounce. Not because your product is bad, but because their psychological state isn’t ready for a purchase decision. Keyword volume without intent alignment is a common CRO strategy failure that costs teams far more than they realize.
The second is unmitigated friction. Conversion is motivation minus friction. Even highly motivated users can be stopped by a slow load, a confusing form, or a CTA buried below the scroll line. Around 81% of users abandon forms before completion due to perceived complexity alone.
The third is funnel fragmentation. Most organizations invest heavily in awareness and interest but leave the decision and action stages structurally broken. Without multi-touch attribution, top-funnel content never gets credit for bottom-funnel conversions, leading to chronic misallocation of budget.
Understanding which of these three is driving your specific drop-off is the starting point for any CRO strategy.
Conversion Rate Benchmarks by Industry in 2025: Know Your Baseline
Before optimizing, you need to know what “good” looks like for your vertical.
The data for 2025 shows conversion rates are highly sensitive to industry type, sales cycle length, and user psychological state. High-urgency, low-stakes sectors perform significantly better than high-consideration ones. SaaS and Professional Services, for instance, typically hover around 1%-2% for general website traffic, while Food & Beverage and Education can exceed 6%.
| Industry | General Website CVR | Google Ads CVR | Avg CPL |
|---|---|---|---|
| SaaS & Technology | 1.2% – 5.0% | 1.2% – 1.5% | $62.80 |
| Finance & Insurance | 1.7% – 5.2% | 2.55% | $83.93 |
| eCommerce & Retail | 1.8% – 4.1% | 3.83% | $47.94 |
| Healthcare | 3.1% – 5.5% | 6.80% – 11.62% | $56.83 |
| Legal Services | 3.2% – 5.3% | 5.09% | $131.63 |
| Education | 2.8% – 6.5% | 11.38% | $90.02 |
| Food & Beverage | 2.6% – 6.17% | 7.09% | $30.27 |
The median across all industries is approximately 2.35%. If you’re in SaaS and converting at 1.3%, you’re not failing. You’re in range. But the ceiling is meaningfully higher, and the math of improving from 1.3% to 2.6% is the same as doubling your revenue without adding a single visitor.
That’s the ROI case for CRO. Research shows that implementing CRO technologies yields an average return of 223%.
What a CRO Strategy Actually Looks Like End-to-End
CRO isn’t a project. It’s a cycle.
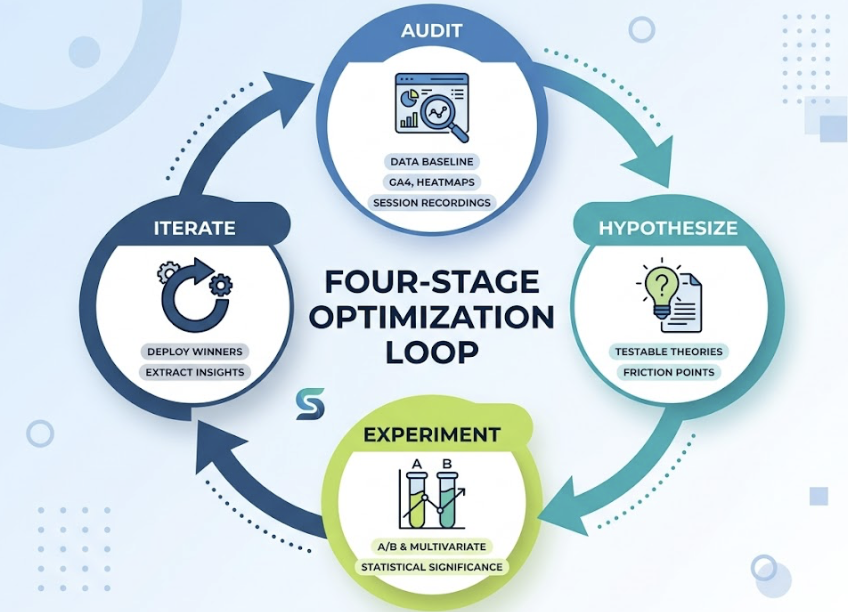
The most effective teams run a four-stage loop: audit (establish a data baseline using GA4, heatmaps, and session recordings), hypothesize (form testable theories tied to specific friction points), experiment (run A/B or multivariate tests with proper statistical significance), and iterate (deploy winners, extract insights from losers, restart).
Organizations that apply this rigorously see an average conversion rate improvement of 49% through A/B testing alone. But there’s a calibration most teams miss.
Only 1 in 8 A/B tests produces a statistically significant result.
That number isn’t a reason to stop testing. It’s a reason to test faster, document hypotheses more carefully, and treat every failed test as behavioral data rather than wasted effort. Volume and velocity matter as much as test quality.
The conversion funnel analysis sits at the center of this loop. Mapping each stage from awareness to action lets you identify exactly where users drop off, so optimization effort goes to the highest-leverage point rather than wherever feels most intuitive.
The Signals Hidden in User Behavior Analysis
Quantitative data tells you where users leave. Behavioral data tells you why.
Three data types are consistently the most useful for identifying conversion blockers.
Heatmaps reveal attention distribution. Click maps show which elements users interact with, and dead clicks — where users click on non-interactive elements — indicate a desire for functionality that doesn’t exist. Move maps expose where attention concentrates before users decide to leave.
Session recordings are closer to a diagnostic tool than an analytics one. Rage clicks (repeated frustrated clicking on an unresponsive element) and navigation loops (users cycling back to the same pages without reaching checkout or contact) are visible patterns that point directly to design and UX failures.
Scroll depth analysis is perhaps the most underused. If your primary CTA is positioned at a depth that only 30% of users reach, the bottleneck isn’t the messaging. It’s the placement. That’s a five-minute fix, not a six-week redesign.
Tools like Hotjar and Microsoft Clarity are the standard for this type of analysis. Microsoft Clarity is free with unlimited traffic and integrates JavaScript error logging, making it particularly useful for identifying technical friction alongside behavioral friction. Hotjar adds survey and feedback capabilities for teams that need qualitative voice-of-customer data alongside the visual layer.
Landing Page Optimization: What Actually Moves the Needle
Landing page optimization is where CRO ROI tends to concentrate fastest.
Because landing pages are often the first point of contact for paid traffic, their performance determines the profitability of entire ad accounts. The lever points are well-documented.
A clear value proposition can improve conversion rates by 34%. Users need to understand within five seconds what the product is, why it matters, and what action to take next. If that’s not immediately obvious, most visitors won’t invest the cognitive effort to figure it out.
CTA design and placement carry more weight than most teams assume. Websites with high-contrast, prominent CTA buttons average 17.85% CVR, compared to 11.48% for subtle designs. And using a single CTA on a page can increase conversions by 371% versus offering multiple competing choices. Choice complexity is friction.
Social proof follows a similar logic. Including customer reviews and ratings can lift conversions by up to 34%, with the effect strongest in high-stakes sectors where trust is a primary purchase barrier.
Then there’s technical performance.
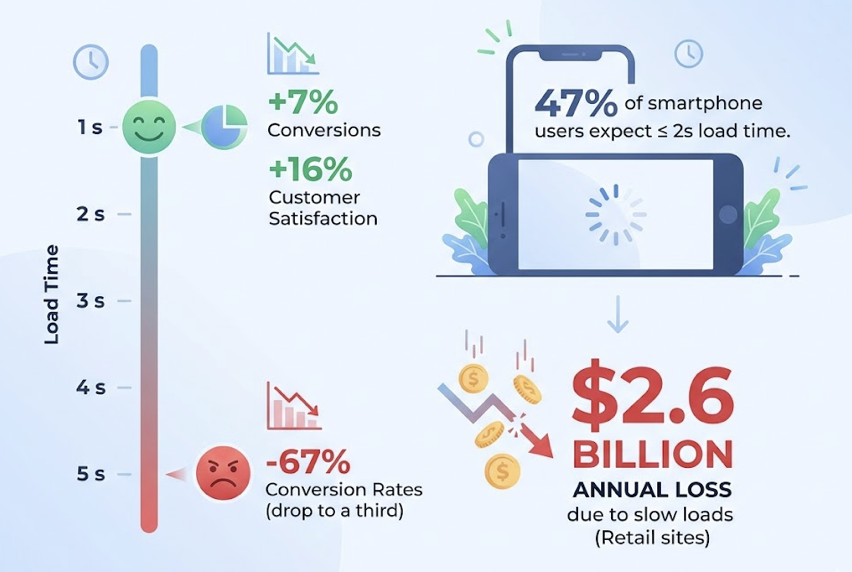
A one-second delay in page load time reduces conversions by 7% and decreases customer satisfaction by 16%. At five seconds, conversion rates drop to roughly a third of the one-second baseline. Retail sites lose an estimated $2.6 billion annually due to slow load times. 47% of smartphone users now expect pages to load in two seconds or less.
Speed isn’t a technical metric. It’s a revenue metric. Treating it as anything less is a strategic oversight.
Bounce Rate Optimization Doesn’t Mean Keeping Everyone Longer
Low bounce rate is a vanity metric. Engagement quality is what matters.
A “bounce” in GA4 (a session with no meaningful engagement) is genuinely bad only when the user left because of friction, not because they completed their task and left satisfied. Someone who finds a phone number or a quick answer and exits is a success, not a failure.
The more useful frame is distinguishing bad bounces (caused by relevance failures, slow loads, or confusing page structure) from neutral exits (task completed, user satisfied). Industry median bounce rates in 2025 range from around 35% for Apparel and eCommerce to 40%-55% for SaaS, with an overall median engagement rate of 56.21% across verticals.
Improving engagement quality comes down to three things: ensuring the hero section immediately echoes the user’s search intent (above-the-fold relevance), targeting an Interaction to Next Paint of 200ms or less (interactivity), and matching content format to search stage. Informational queries deserve long-form authoritative content. Commercial queries deserve fast, streamlined product pages. Mixing these up is one of the most common causes of high bounce rates that analytics alone can’t diagnose.
Website Conversion Tracking: You Can’t Optimize What You Can’t Measure
Most teams are measuring macro conversions and calling it done. That’s the equivalent of only checking your score at the end of the game.
Micro conversions — “Add to Cart,” “Pricing Page View,” “Video View,” “Newsletter Signup” — are the early warning system for funnel health. They generate the data volume needed for statistically significant A/B tests long before macro conversion numbers are large enough to use. In GA4, tracking them requires identifying the relevant events (predefined or custom), then marking them as key events in the Admin section. It’s a configuration step, not a development project.
The more structurally important issue is attribution.
The modern customer journey is rarely linear. A user might discover a brand through an AI search result, return via a retargeting ad, then convert after clicking a promotional email. Last-click attribution, which remains the default in many tools, gives 100% credit to the email and zero credit to the AI discovery that started the whole journey.
Companies that switch to data-driven attribution models typically see a 6% lift in total conversions simply by identifying and properly funding the assisted conversion touchpoints that were previously invisible. For B2B funnels with long sales cycles, W-shaped or position-based models generally provide more accurate representations of actual influence.
The Conversion Gap That AI Search Traffic Creates
Here’s what most CRO frameworks haven’t caught up to yet.
A growing share of web traffic now originates from AI platforms. ChatGPT, Perplexity, and Gemini are increasingly the first point of discovery for users researching products and services, and the conversion behavior of this traffic cohort is structurally different from organic search.
AI-referred traffic arrives pre-qualified. The AI has already vetted the brand and provided a recommendation before the user clicks. This “collapsed funnel” effect means AI-referred traffic converts at 5 to 23 times the rate of traditional organic search. Case studies show ChatGPT traffic converting at 15.9%, compared to 1.76% for Google organic.
That’s not a marginal difference. That’s a different category of visitor.
The challenge is twofold. First, 83% of AI-mediated searches result in zero clicks, meaning discovery and opinion-forming happen entirely within the chat interface. Brands that aren’t being cited don’t get a conversion opportunity at all. Second, ChatGPT strips referrer data from its paid accounts, so this high-intent traffic frequently appears as “Direct” in GA4, leading to systematic undervaluation of the AI acquisition channel.
Traditional CRO tools can’t see any of this.
This is where platforms like Topify address a gap that standard analytics stacks leave open. Topify’s CVR (Conversion Visibility Rate) metric estimates the probability that a brand will be cited as the primary recommendation for a given AI prompt, giving marketers a leading indicator of AI-sourced conversion potential rather than discovering it after the fact. Its Source Analysis capability identifies specific topics where competitors are being cited by AI platforms while a brand is being ignored, pointing directly to the content gaps that suppress AI citation rates.
For teams running CRO programs in 2025, optimizing for AI citations is becoming as structurally important as optimizing for landing page load time. The traffic quality is higher. The measurement infrastructure is largely missing. And the gap between brands that understand this and those that don’t is widening.
Conclusion
The core insight from 2025 conversion data is consistent: the traffic problem is almost always a yield problem.
Marginal gains in traffic volume are increasingly expensive. Marginal gains in conversion rate compound into meaningful revenue with no additional acquisition spend. Improving from 1% to 2% doubles revenue. Improving from 2% to 3% adds 50% more. The math is structurally favorable.
The execution path is clear. Diagnose friction with behavioral data before making design changes. Track micro conversions to identify funnel leaks before they become revenue gaps. Treat page speed as a financial metric. Use multi-touch attribution to understand the full acquisition story. And account for AI search traffic as a distinct cohort with distinct conversion dynamics — one that requires different tooling and a different optimization mindset.
The gap isn’t where the traffic comes from. It’s what happens after it arrives.
FAQ
Why does my site have high traffic but a low conversion rate?
In most cases, it’s one of three causes: intent mismatch (visitors arriving at pages that don’t match their current stage in the decision process), technical friction (slow load times, confusing forms, or poor mobile experience), or a weak above-the-fold value proposition. Tools like Microsoft Clarity or Hotjar can identify the specific exit point and behavior pattern that signals which issue is dominant.
What are realistic conversion rate benchmarks by industry in 2025?
The overall median sits around 2.35%. SaaS and Professional Services typically range from 1% to 5% depending on funnel stage. Education and Food & Beverage tend to perform above 6%. High-urgency industries with short decision cycles consistently outperform complex B2B or financial categories. Your benchmark is less about the global average and more about what’s achievable in your specific vertical and traffic mix.
How do I track micro conversions in Google Analytics 4?
In GA4, identify the events you want to track — either from GA4’s predefined event library or by creating custom events. Once the event is being captured in your account, go to Admin > Events and toggle “Mark as conversion” on for that specific event. Micro conversions like Pricing Page Views or Video Completions immediately become trackable KPIs alongside macro conversion goals.
How does website speed actually affect conversion rate?
A one-second delay reduces conversions by 7%. Sites loading in one second convert at roughly 2.5x the rate of those loading in five seconds. At ten seconds, bounce probability increases by 123% compared to a one-second baseline. Speed is also a trust signal: 82% of customers report trusting fast sites more than slow ones, which compounds the conversion effect beyond pure patience thresholds.
How do I improve the conversion rate of AI search traffic?
The starting point is ensuring content consistency: the experience on your landing page needs to match exactly what the AI described. Beyond that, you need visibility into what AI platforms are saying about your brand and where you’re being cited or excluded. Platforms like Topify provide CVR measurement and source gap analysis specifically for this use case, identifying the prompt topics and content types where competitors are earning AI citations while your brand isn’t appearing.
How do I reduce bounce rate without just keeping people on the page longer?
Focus on relevance, not retention. Ensure the first screen matches the intent of the traffic source precisely. If a user clicks an ad about pricing, the page should immediately show pricing. Check scroll depth data to confirm key content is reaching the users who would benefit from it. And separate “bad bounces” caused by friction from neutral exits where users completed their task and left. GA4’s Engagement Rate metric is more useful than raw bounce rate for this distinction.

