You set up an AI visibility tracker. You pointed it at 100 prompts. You left it running.
Then the invoice arrived.
If you’ve experienced that moment, you’ve just joined a growing cohort of marketing teams dealing with what the industry now calls “Claude-lash.” It’s not a bug. It’s not a vendor mistake. It’s a structural math problem that most tracking setups have baked in from day one.
Here’s what’s actually happening, and what the numbers look like when you finally do the math.
What “Claude-Lash” Actually Is
The term entered the industry lexicon in mid-April 2026, following the release of Anthropic’s Claude Opus 4.7.
The frustration wasn’t really about model quality. It was about a cost structure nobody had budgeted for: reasoning tokens. Unlike standard models that generate output in a predictable linear sequence, reasoning-heavy models like Opus 4.7 engage in internal “thinking” cycles before producing a visible response. Those internal cycles are billed at completion rates, not at a discount.
The ratio can hit 20:1. For every token you see, the model may have burned 20 internally.
For a team running automated brand monitoring across dozens of prompts, that math compounds fast. A query that cost pennies in 2025 started burning through API credits at a rate that didn’t show up until the end-of-month billing cycle.
That’s Claude-lash: the gap between what you thought AI visibility tracking costs and what it actually costs, once reasoning overhead enters the picture.
The Math Most Teams Skip
Here’s the core problem with how most teams measure AI visibility: they treat it as a deterministic system.
In traditional SEO, if your brand ranked #1 for a keyword, that was a stable observable fact. Every user in the same geography saw the same result. You could check it once and trust the answer.
AI search doesn’t work that way.
The same prompt sent to ChatGPT ten times can yield ten different brand mentions depending on session state, geographic routing, and model sampling temperature. A brand that “appears” in 3 out of 10 responses doesn’t have 30% visibility. It has a probability range, and the actual appearance rate might fall anywhere between 10% and 50% depending on sample size.
To establish statistically meaningful visibility, teams need to run what researchers call “Swarm Probing”: multiple iterations of the same prompt, across different user contexts and geographic nodes. A reliable GEO baseline requires at least 10 runs per prompt, and ideally 20 or more for high-stakes commercial queries.
Here’s where the numbers start to look different from what most budgets assume.
A team tracking 100 prompts, checked across 3 platforms, sampled 20 times each for statistical reliability, running weekly, generates:
100 × 3 × 20 × 4 = 24,000 analyses per month.
At a basic plan’s 9,000 analysis limit, that’s nearly 3x overrun before you’ve even opened the first report. Most teams don’t discover this until they’ve been throttled or billed for overages.
Three Places Your Tool Is Burning Tokens Right Now
Token waste in AI visibility tools isn’t random. It concentrates in three predictable places, and each has a specific technical cause.
1. System prompt repetition without caching
Every automated LLM call requires a system prompt, which defines what the agent should do. Most tracking tools send the same instruction block with every single query. If that block is 2,000 tokens and the platform supports prompt caching (which both OpenAI and Anthropic do for prompts over 1,024 tokens), cache hits are billed at just 10% of the standard input price.
A tool that doesn’t use caching is paying a 900% tax on its own instructions, on every call, every day.
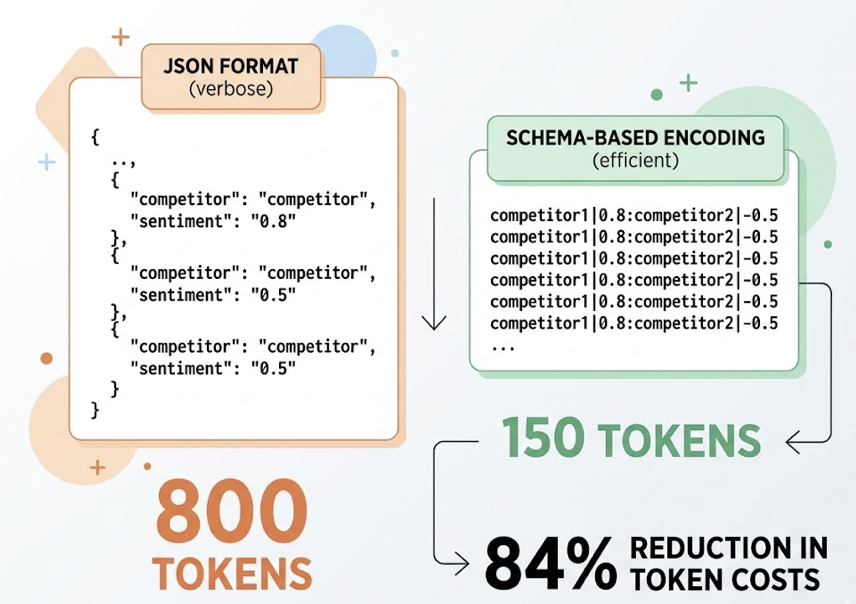
2. Verbose JSON serialization
Most enterprise tracking stacks use JSON to pass data between components. JSON is human-readable, but it’s a poor format for tokenization. Structural overhead from brackets, quotes, and repeated field names adds up. A list of 10 competitors with sentiment scores in JSON might consume 800 tokens. The same data in a minimal delimiter format (using | or :) can compress to around 150 tokens. Teams that have switched to schema-based encoding for their tracking payloads report up to 84% reduction in token costs, with no loss in accuracy.
3. RAG context stuffing
When a tool tries to diagnose why your brand is missing from an AI answer, it typically retrieves content from the web and injects it into the prompt for analysis. The failure mode is indiscriminate retrieval: pulling the full text of the top 10 search results and feeding everything into the context window.
Context windows above 100,000 tokens are expensive to process and create “attention leaks,” where the model loses focus on the core task. Tools that use semantic reranking to inject only 3-8 highly relevant content blocks of 300-400 tokens each report up to 47% reduction in context token usage, while actually improving analytical accuracy.
| Waste Source | Technical Cause | Optimization Potential |
|---|---|---|
| System prompt repetition | No prompt caching | 90% cost reduction on instructions |
| JSON serialization | Verbose field structure | 70-84% reduction in payload tokens |
| RAG context stuffing | Indiscriminate document retrieval | 47% reduction in context tokens |
Combined, these three inefficiencies can inflate your API bill by 40-70% above what an optimized architecture would cost for the same coverage.
Why Prompt Volume Is the Lever Nobody Talks About
Most teams track 10 to 20 branded queries. They see their brand name show up in ChatGPT and conclude that AI visibility is “working.”
It’s not.
Research shows that 80-85% of brand mentions in AI responses originate from external domains: Reddit threads, G2 reviews, YouTube comparisons, niche publications. The AI isn’t citing your homepage. It’s citing whoever wrote the most useful third-party content about your category.
And here’s what makes this expensive: AI search users don’t ask head terms. The average AI query runs 23 words. “What’s the best CRM for a 10-person SaaS team that needs Salesforce integration and doesn’t want to pay enterprise pricing?” If you’re only tracking “CRM software,” you’re invisible to the queries where purchase intent actually lives.
A meaningful GEO baseline requires tracking 25-100 context-rich prompts per category. But not all prompts are equal.
This is where intelligent prioritization matters more than volume. Topify‘s High-Value Prompt Discovery scores each prompt across four factors: AI query volume (30%), visibility gap relative to competitors (25%), commercial intent signals (25%), and content readiness of existing brand assets (20%). That scoring system lets teams direct their token budget toward the prompts that move the needle, rather than running uniform coverage across hundreds of low-value queries.
The difference between tracking 100 random prompts and tracking 100 scored prompts is the difference between burning a budget and building a strategy.
The $480 vs. $19.80 Case Study
Here’s what the math actually looks like when you model it out.
Scenario: A SaaS company tracking 100 high-intent prompts, checked weekly with 20 sampling iterations per prompt across 3 platforms.
Total monthly analyses: 100 × 3 × 4 × 20 = 24,000 requests
Path A: Always use the flagship model (no optimization)
Using a model like Claude Opus 4.6 for every step, without caching:
- Cost per analysis: ~$0.020
- Monthly total: $480
Path B: Intelligent model routing with caching
Routing routine mention-checks (90% of requests) to a budget-tier model like Gemini Flash-Lite, and running sentiment analysis (10% of requests) on a flagship model with prompt caching enabled:
- Budget-tier mention checks (21,600 requests): $5.40
- Flagship sentiment analysis with caching (2,400 requests): $14.40
- Monthly total: $19.80
That’s a 95.8% reduction in cost for the same analytical output. The only difference is architecture. Both paths track the same 100 prompts. Both produce statistically valid visibility scores. One costs 24 times more.
The “Claude-lash” backlash was never about Claude being worse. It was about teams running Path A workflows without realizing Path B existed.
What Efficient AI Visibility Tracking Actually Looks Like
The shift in 2026 isn’t from “bad tools” to “good tools.” It’s from dashboards to operating systems.
A dashboard tells you what happened. An operating system tells you why, and closes the loop automatically.
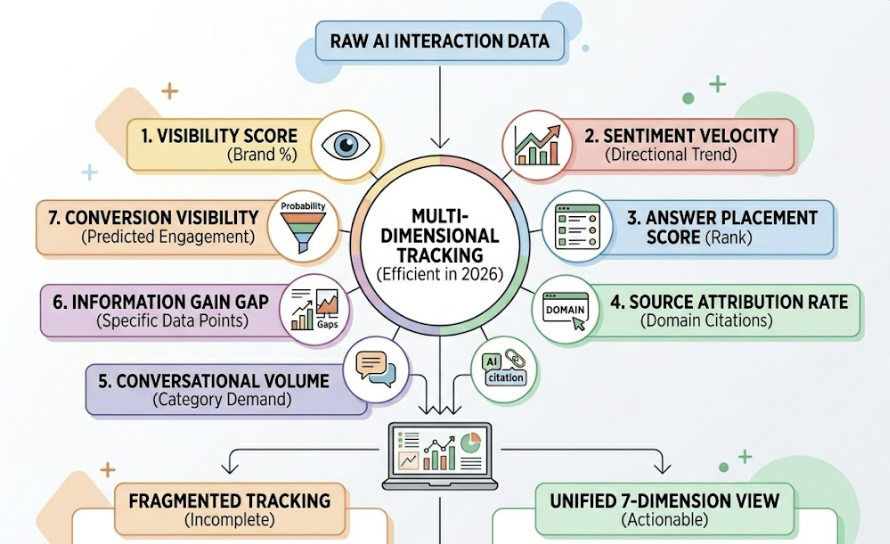
Efficient tracking in 2026 means monitoring seven distinct dimensions simultaneously: Visibility Score (what percentage of responses include your brand), Sentiment Velocity (the directional trend, not just the current score), Answer Placement Score (where in the response you appear), Source Attribution Rate (are AI citations going to your domain or to third-party reviews), Conversational Volume (actual demand for your category in AI interfaces), Information Gain Gap (specific data points competitors have that you don’t), and Conversion Visibility Rate (predicted probability that a mention leads to an engagement).
Most tools track one or two of these. Usually the easiest ones to measure.
The placement metric is particularly undertracked. Princeton University research has established that entities mentioned earlier in a narrative AI response carry significantly more weight in user decision-making. Topify‘s Answer Placement Score (APS) captures this by assigning a 1.0 weight to the primary recommendation, 0.6 to the second position, and below 0.3 to anything lower. A brand that appears in position 4 of an AI answer is, in practice, invisible.
And when traditional organic CTR has collapsed by 62.3% for queries where an AI summary appears, position within that AI answer matters more than position on the SERP below it.
Running Your Own 30-Day Token Audit
You don’t need a new tool to start optimizing. You need to run the math on what you’re currently spending.
Step 1: Count your active prompts. How many unique prompts is your tool checking each month? Include all platforms.
Step 2: Estimate token consumption per query. A typical analysis query runs roughly 500 tokens of cached system instructions, 1,000 tokens of data input, and 500 tokens of output. Without caching, add the full instruction block to every call.
Step 3: Multiply by your sampling frequency. If you’re checking each prompt once per day without iterating for statistical confidence, your data isn’t reliable. If you’re running Swarm Probing at 20 iterations per prompt, model out the actual monthly request volume.
Step 4: Model the cost across two paths. Take your current estimated monthly token usage and price it at flagship rates. Then price the same workload using a tiered architecture with budget models for mention checks and prompt caching for instruction overhead. The gap between those two numbers is your optimization opportunity.
Step 5: Identify your low-value prompts. In most tracking setups, 20% of prompts generate 80% of actionable insight. Find the bottom half of your prompt list and drop query frequency to weekly or monthly instead of daily. Redirect the freed-up analysis budget to Swarm Probing on your highest-stakes competitive prompts.
The goal isn’t to track less. It’s to track smarter.
The Architecture Determines the Bill
Token costs aren’t a pricing problem. They’re a design problem.
The most expensive setups in 2026 aren’t using the most prompts. They’re using the wrong model tier for routine tasks, skipping caching for repeated instructions, and retrieving far more context than any analysis actually requires.
An additional cost that most teams miss: a standard analytics platform like GA4 misclassifies roughly 70.6% of traffic arriving from AI tools as “Direct” traffic. Without log-level attribution that correlates AI crawler activity with subsequent citation events, you can’t prove that any of your GEO optimization actually led to a lead or a sale. The ROI calculation stays broken.
Efficient architecture addresses all three layers: model routing, prompt optimization, and attribution. Topify’s platform is built around this model, running up to 60-100 prompt iterations to establish statistically valid visibility scores, using intelligent model cascading to keep costs inside its 9,000 monthly analysis structure, and providing Source Forensic analysis that traces why a specific competitor is being cited instead of your brand.
The AI search era converts at 4.4 to 23 times the rate of traditional organic search. That gap makes AI visibility worth paying for. It doesn’t make it worth overpaying for.
Conclusion
Claude-lash isn’t really about Claude. It’s about what happens when a team treats a probabilistic system like a deterministic one and doesn’t do the token math until the bill arrives.
The fix isn’t switching models. It’s building the right architecture: Swarm Probing for statistical validity, tiered model routing for cost efficiency, prompt caching for instruction overhead, and semantic chunking for context management.
Start with a 30-day audit. Run the two paths. Find the gap.
If you want to see what efficient AI visibility tracking looks like in practice, Topify’s Basic plan includes a 30-day trial with access to cross-platform tracking across ChatGPT, Perplexity, and AI Overviews, and the analytical infrastructure to tell you not just whether your brand appears, but where, why, and what to do about it.
Frequently Asked Questions
What is Claude-lash in AI visibility tools?
Claude-lash refers to the backlash that emerged in April 2026 when marketing teams discovered that AI visibility tracking costs had spiked unexpectedly due to reasoning token overhead in models like Claude Opus 4.7. Reasoning models process internal “thinking” cycles that are billed at standard completion rates, sometimes consuming tokens at a 20:1 ratio relative to visible output. For teams running automated brand monitoring at scale, this created budget overruns that weren’t visible until end-of-month invoicing.
How many tokens does tracking 100 prompts across 3 AI platforms actually consume per month?
With statistical sampling at 20 iterations per prompt for reliability, checking weekly: 100 prompts × 3 platforms × 20 iterations × 4 weeks = 24,000 analyses per month. At flagship model rates without caching, this runs roughly $480/month. With intelligent model routing and prompt caching, the same workload can cost under $20/month, a difference of about 95%.
Can I reduce token costs without losing visibility coverage?
Yes, through three specific optimizations. First, enable prompt caching for system instructions (billing cache hits at 10% of standard input price). Second, replace JSON serialization with compact delimiter formats in your data payloads. Third, implement semantic reranking in your RAG pipeline to inject only the 3-8 most relevant content blocks rather than full document text. Together these can reduce token consumption by 40-70% without reducing analytical output.
How does Topify manage token usage for AI visibility tracking?
Topify’s platform uses intelligent model cascading to route routine mention-checks to budget-tier models while reserving flagship models for sentiment and narrative analysis. Its High-Value Prompt Discovery system scores each prompt across query volume, visibility gap, commercial intent, and content readiness, so analysis budget concentrates on the prompts with the highest optimization ROI. The 9,000 monthly AI answer analysis structure is designed around Swarm Probing efficiency rather than flat daily polling.

